Service / Free TradingView Indicators
Free TradingView Indicators
A library of 40+ free analysis indicators for TradingView, organized by category — trading sessions, ATR volatility, VWAP, trend, oscillators, price structure, volume and risk management. No sign-up required. Add any of them straight to your chart with the “Add to TradingView” button on each card.
01 — Free indicator library
Free indicators (40)
Browse by category. See how each tool works under “View details.”
Sessions / Time
5 toolsTokyo London New York Session Highlighter
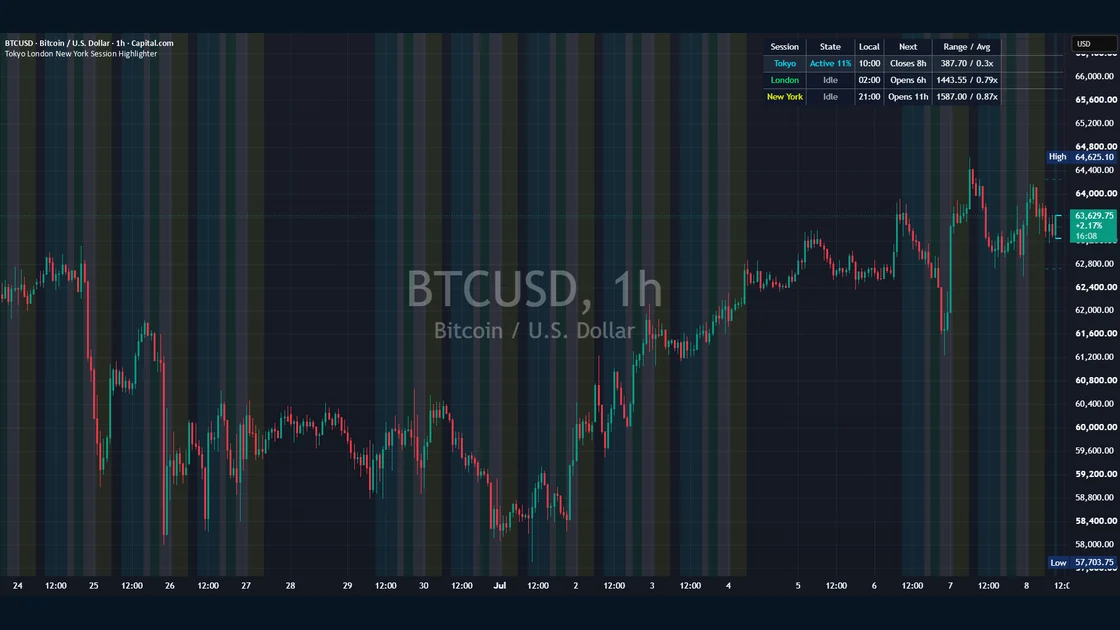
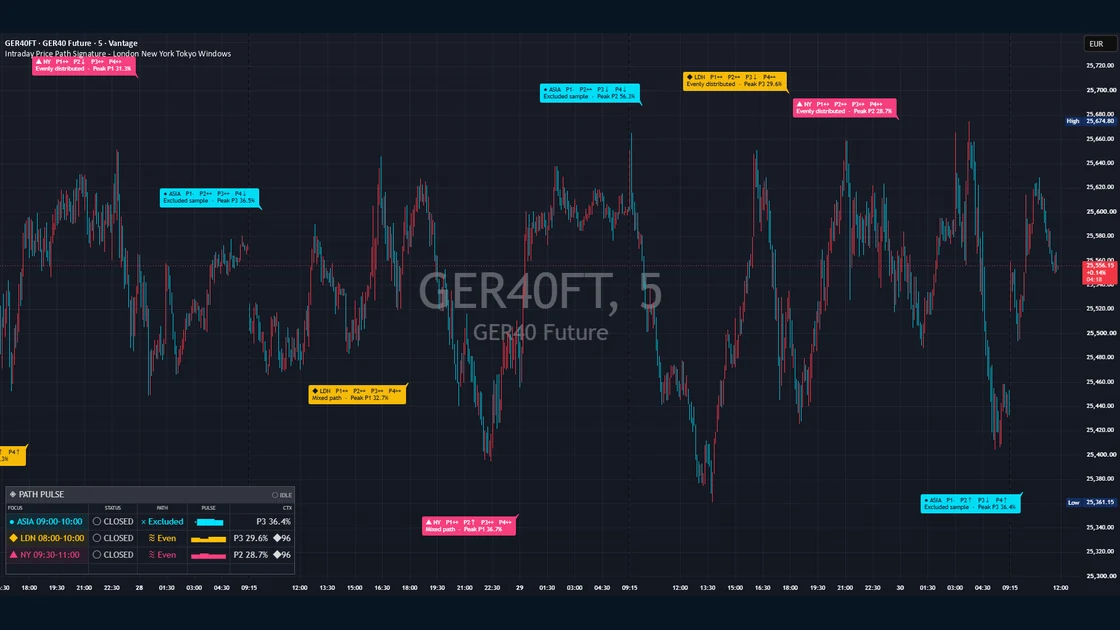
Shades the Tokyo, London and New York sessions on the chart background so you can see which market is active at a glance. Includes active-session high/low lines, overlap priority, start/end markers, a live status table and optional alerts — a clean, non-directional way to read time-of-day behavior.
ForDay traders who want to read how each session behaves
Session Divider Lines
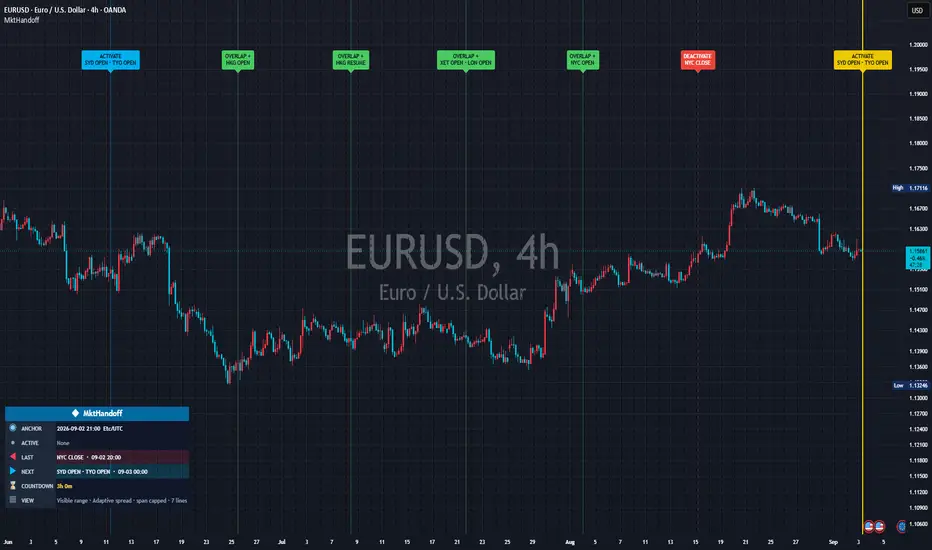
Marks each market’s open and close with vertical lines on the chart.
ForTraders mindful of when sessions hand over
Opening Range
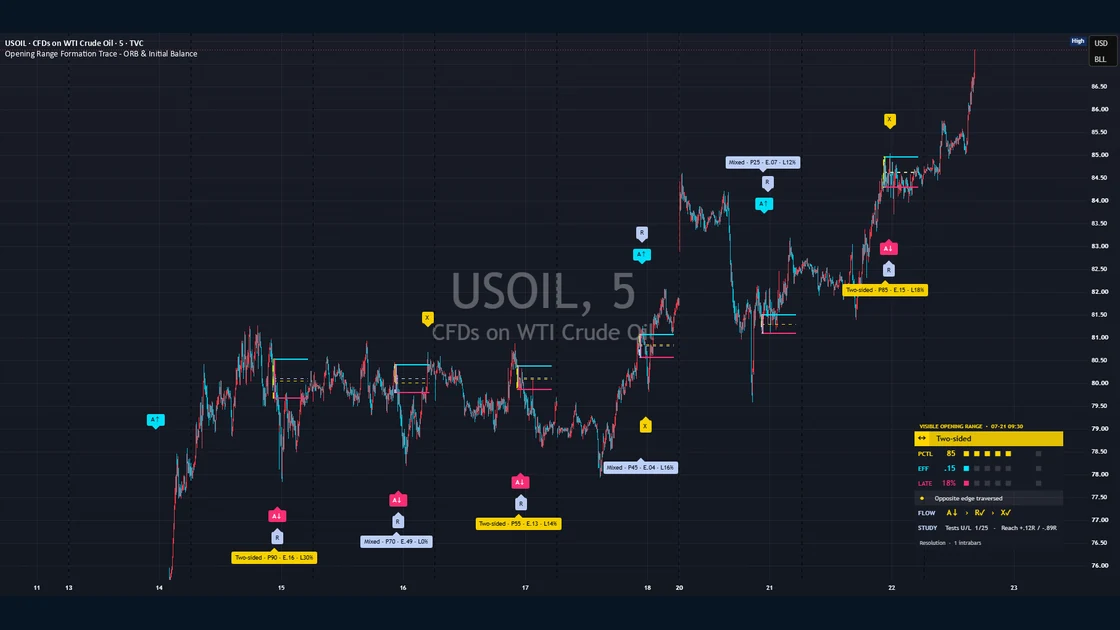
Draws a box around the high and low of the first set period after the open.
ForTraders who anchor to the opening range
Previous Day / Week High & Low
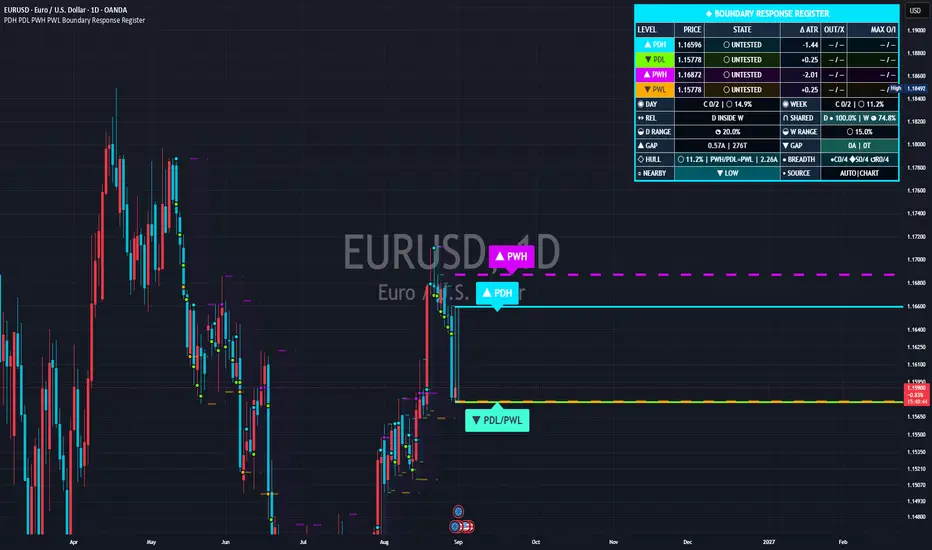
Automatically plots the prior day and prior week highs and lows as horizontal lines.
ForTraders checking nearby key levels
Kill Zone Highlighter
Highlights high-attention time windows to set them apart from the rest of the day.
ForTraders focusing on specific time windows
Volatility / ATR
7 toolsVolatility Regime Dashboard
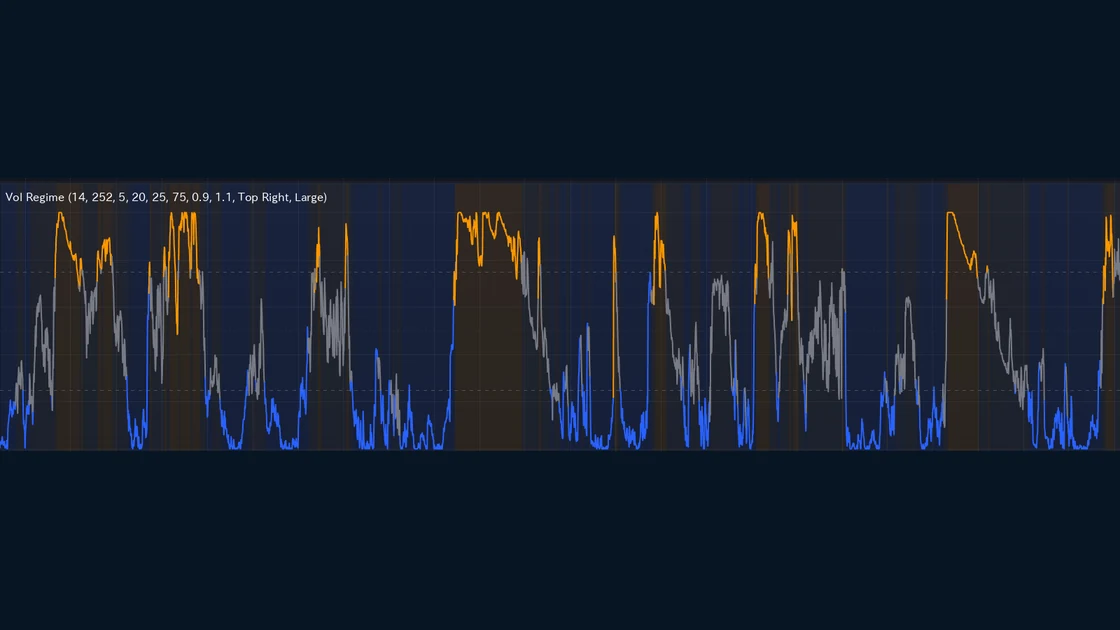
Combines two independent measures — a price-normalized ATR percentile and a fast/slow ATR compression ratio — and only switches state when both agree (hysteresis), for a low-noise read of Compressed / Normal / Expanded. Background shading and an info table show whether the market is calm or wild at a glance.
ForTraders who want to gauge whether the market is calm or volatile — its regime
ATR Volatility Bands
Visualizes the price range with upper and lower bands based on ATR.
ForTraders who want a feel for typical price travel
ATR Stop Guide
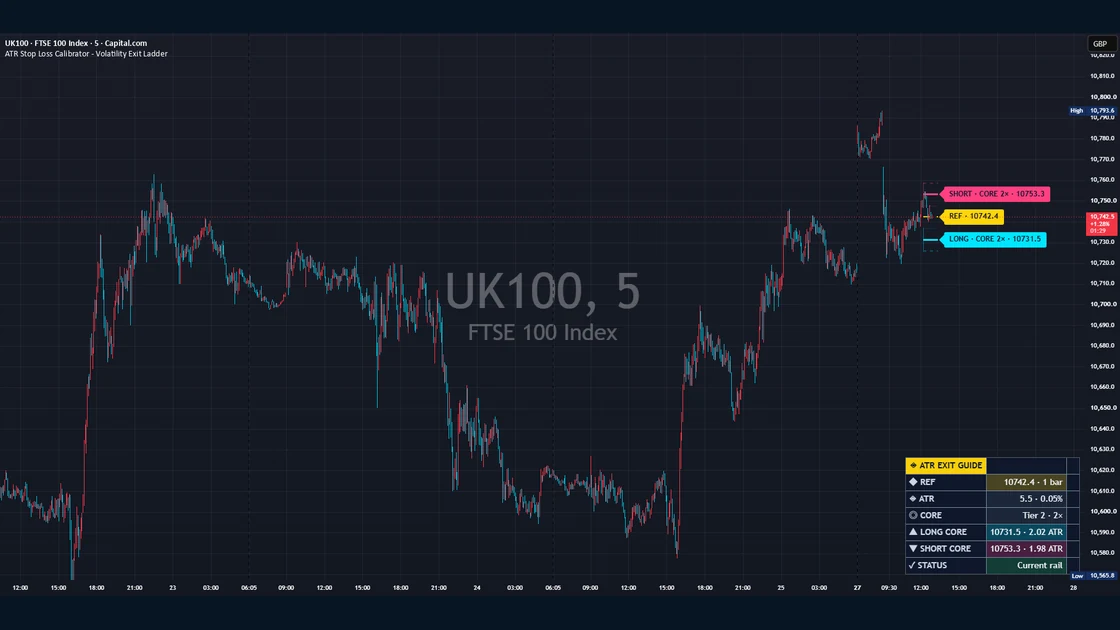
Draws reference exit levels at a chosen multiple of ATR.
ForTraders who size stops by volatility
Keltner Channel ATR Stretch
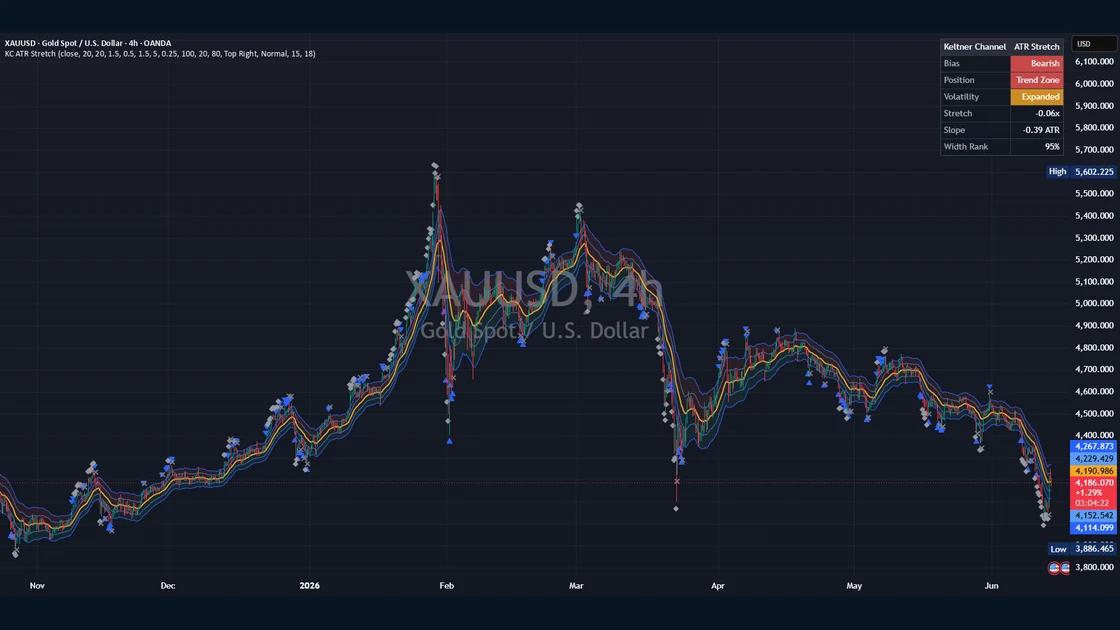
Plots an EMA-based channel scaled by ATR and reads the chart state for you in one compact dashboard — trend Bias, Position within the channel, Volatility width (quiet/normal/expanded) and Stretch from the basis. A context tool for spotting trend lean and over-extension at a glance, not a signal generator.
ForTraders who want trend lean and over-extension in one view
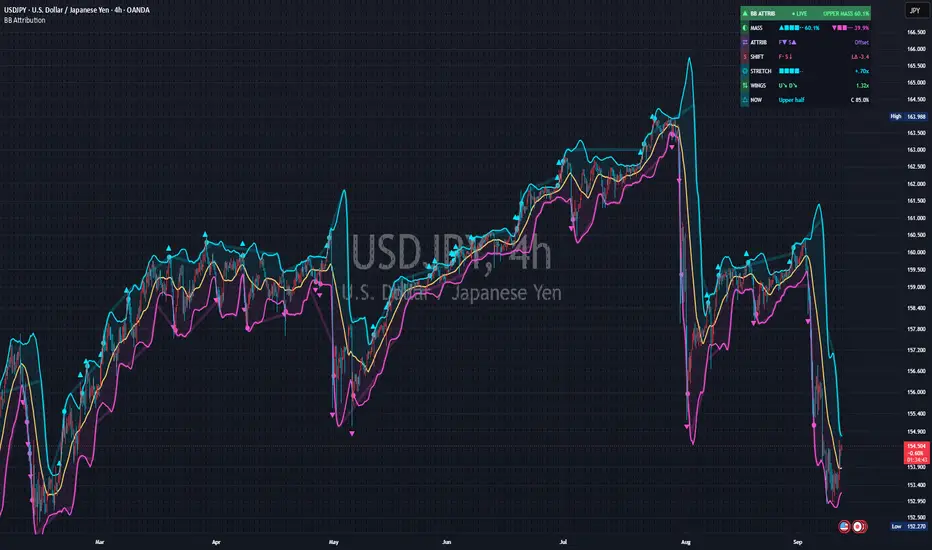
Bollinger Bands
Plots a moving average ± standard deviation to show dispersion and squeezes.
ForTraders watching dispersion and contraction
Historical Volatility
Shows realized volatility over a set period in a sub-pane.
ForTraders who want volatility as a number
ATR Percent
Normalizes ATR as a percentage of price.
ForTraders comparing volatility across symbols
VWAP / Average price
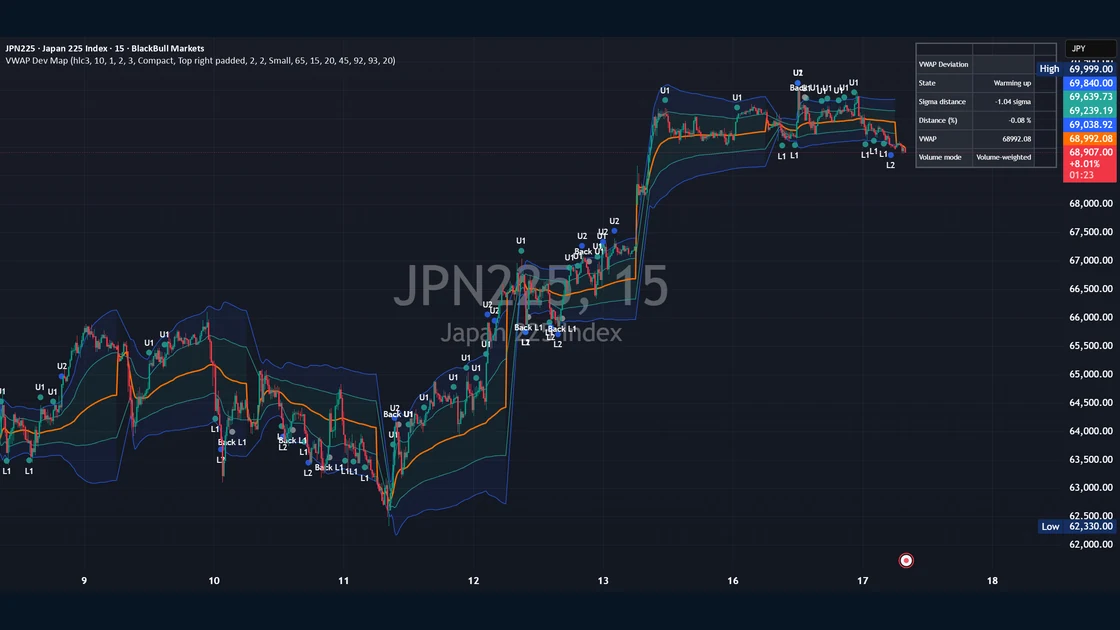
5 toolsVWAP + Deviation Bands
Plots the current exchange day’s VWAP with volume-weighted standard-deviation bands (inner, outer and an optional tail) and reads the sigma- and percent-distance from VWAP. A compact dashboard sums up a neutral location state (near VWAP / inner range / one-sigma edge / two-sigma extension / outer tail) and the active volume mode, falling back to equal weight when volume is unusable. Confirmed-bar markers for band and VWAP crossings round out a context tool for gauging how far price has stretched from the average.
ForTraders watching deviation from the average price
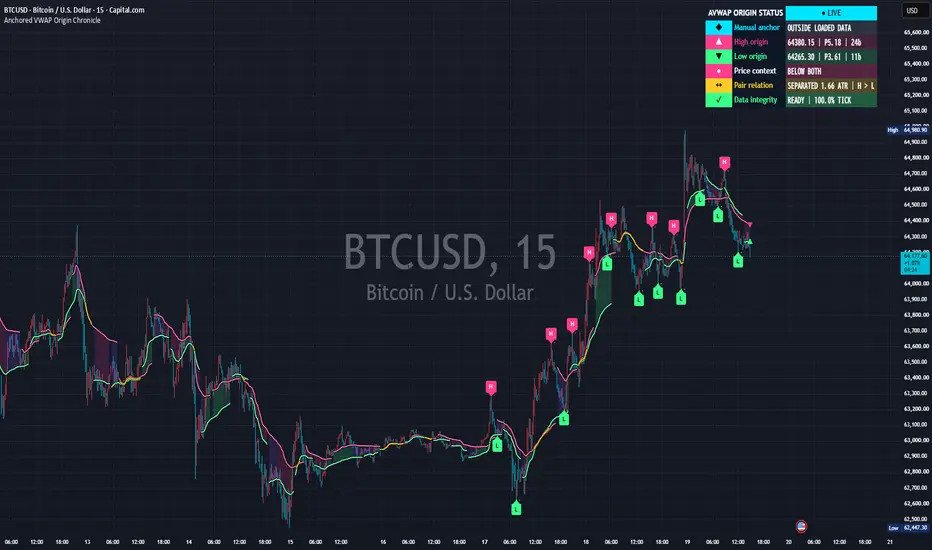
Anchored VWAP
Draws a VWAP from a starting point you choose.
ForTraders anchoring the average to a key high or low
Weekly / Monthly VWAP
Displays weekly and monthly VWAPs together.
ForTraders who want a longer-horizon average
Multi-Anchored VWAP
Shows VWAPs from several anchor points at once.
ForTraders comparing multiple references
Moving Average Ribbon
Displays several periods of moving averages as a ribbon.
ForTraders reading trend slope and convergence
Trend / Moving averages
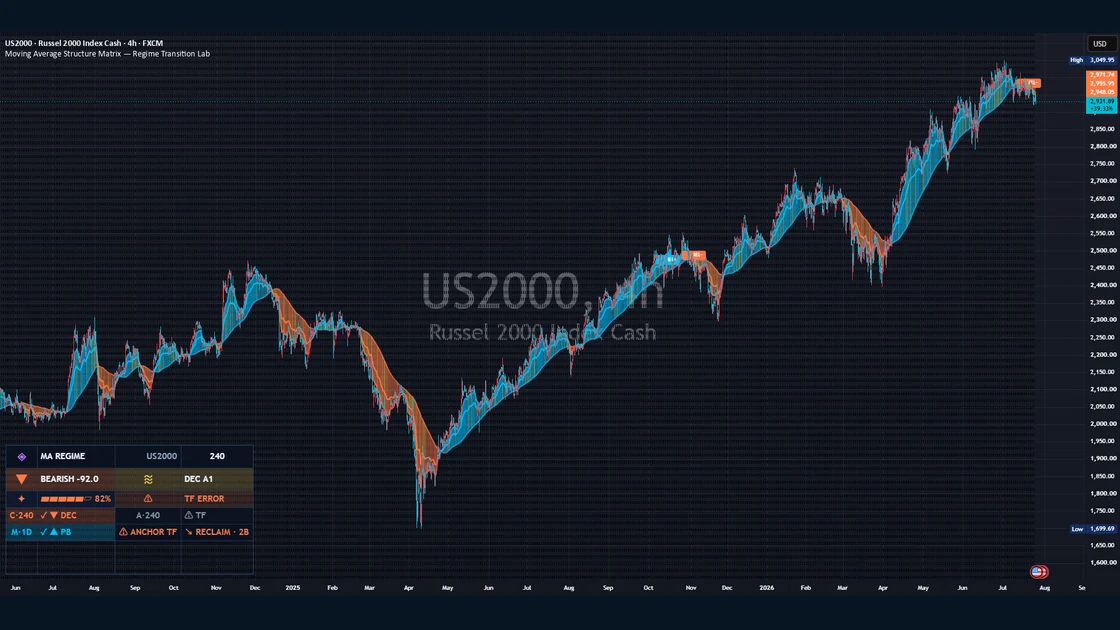
5 toolsMoving Average Structure Matrix
Not a basic multi-MA ribbon, but a tool that reads how several EMA/SMA lines are ordered, clustered and positioned as a single structure. It derives a Stack Score (whether shorter MAs sit above or below longer ones), Order Purity (how consistent the dominant ordering is), Slope Consensus (whether the MAs are rising, falling or flat), Bundle Width (the distance between the highest and lowest enabled MA) and Twist Rate (how often MA pairs reorder or cross), and combines them into neutral descriptive labels for an overall Structure State. Built on the premise that moving averages lag by design and that a clean structure does not guarantee continuation, it’s a context tool for quickly reading the structural picture from multiple EMA/SMA lines.
ForTraders who want quick structural context from multiple EMA/SMA lines
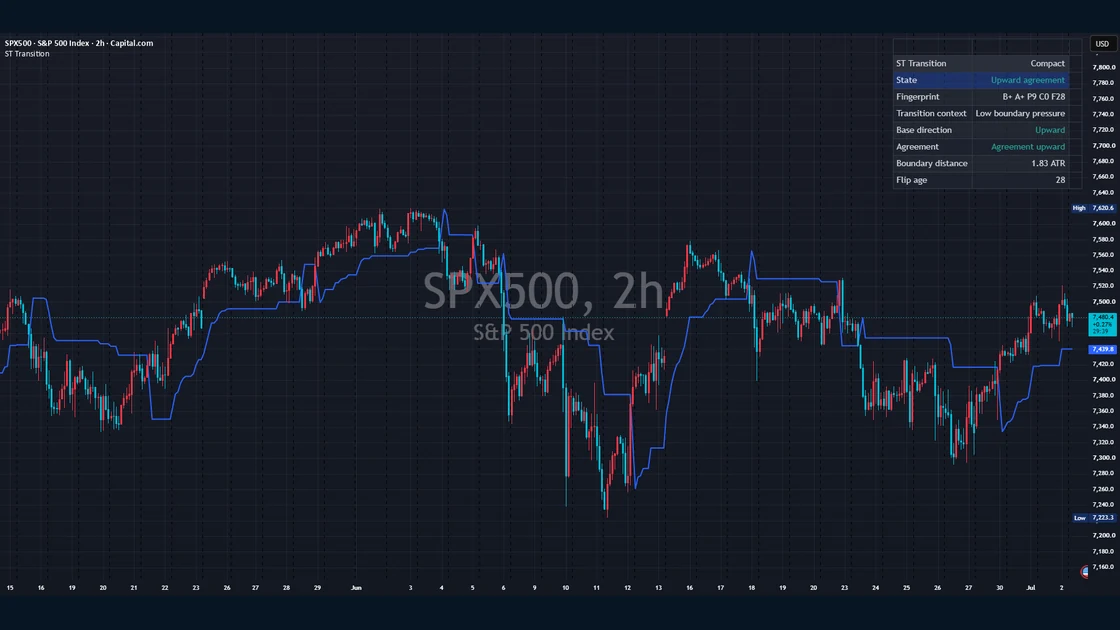
Supertrend Transition Framework
Uses a manually calculated ATR-based Supertrend boundary as the visible base layer, then adds a neutral transition layer for profile agreement, boundary distance in ATR, transition pressure, flip age, boundary touches, flip cascade context, trail slope, ATR input drift and a compact state fingerprint. Built for traders who want a trend-direction reference from ATR-based trailing boundaries while also seeing boundary proximity, profile agreement, recent transitions and trail behavior in one context table.
ForTraders who want an ATR-based trend-direction reference plus transition context
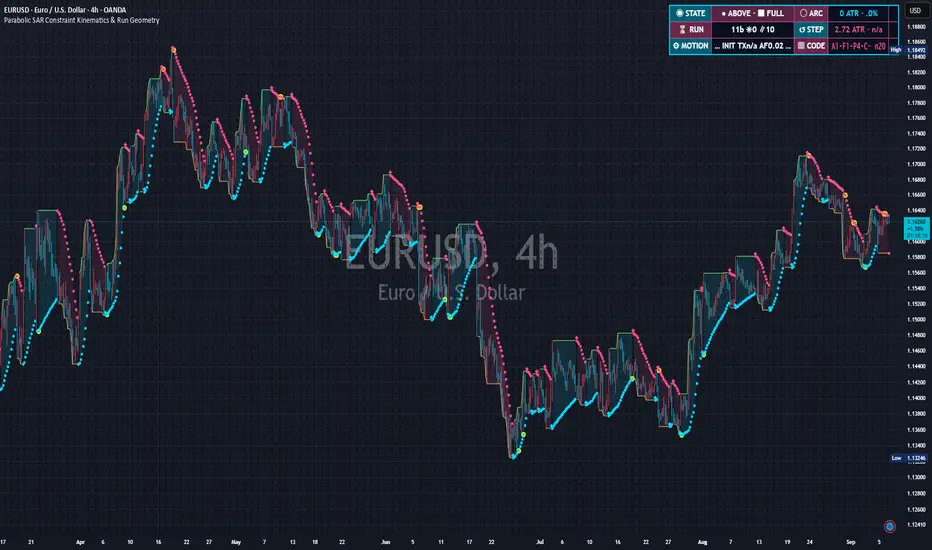
Parabolic SAR
Plots dots that mark potential reversal points.
ForTraders following trend pullback points
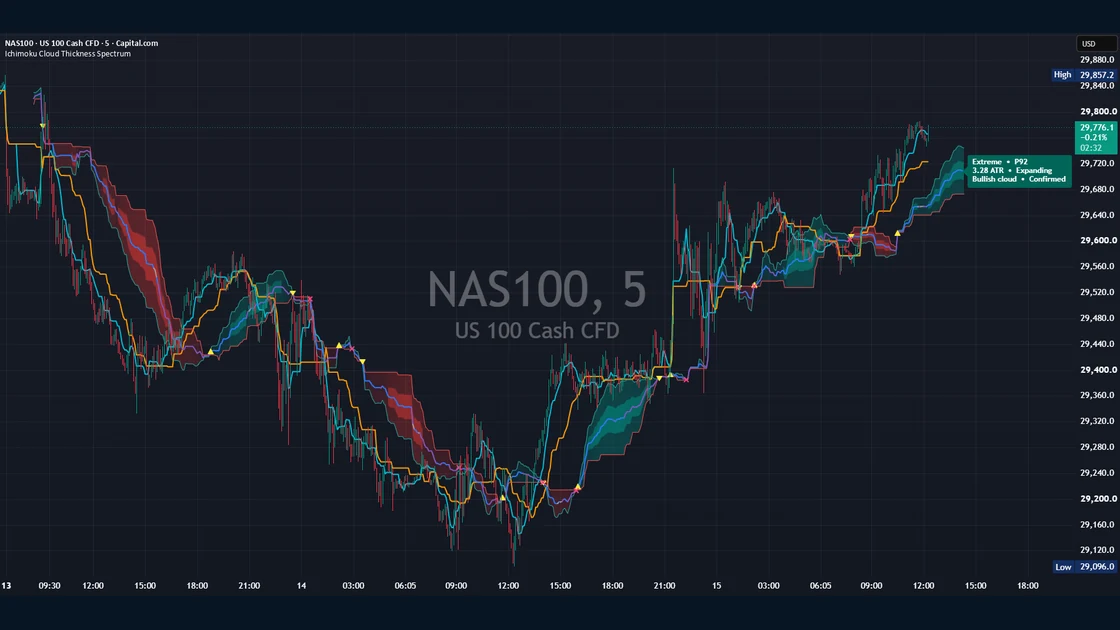
Ichimoku Cloud Thickness Spectrum
Measures the distance between Leading Span A and Leading Span B and visualizes relative cloud thickness, compression and expansion as a spectrum. It is a context tool for reading changes in Ichimoku cloud structure rather than a standalone trading signal.
ForTraders who want to read relative Ichimoku cloud thickness, compression and expansion as market-structure context
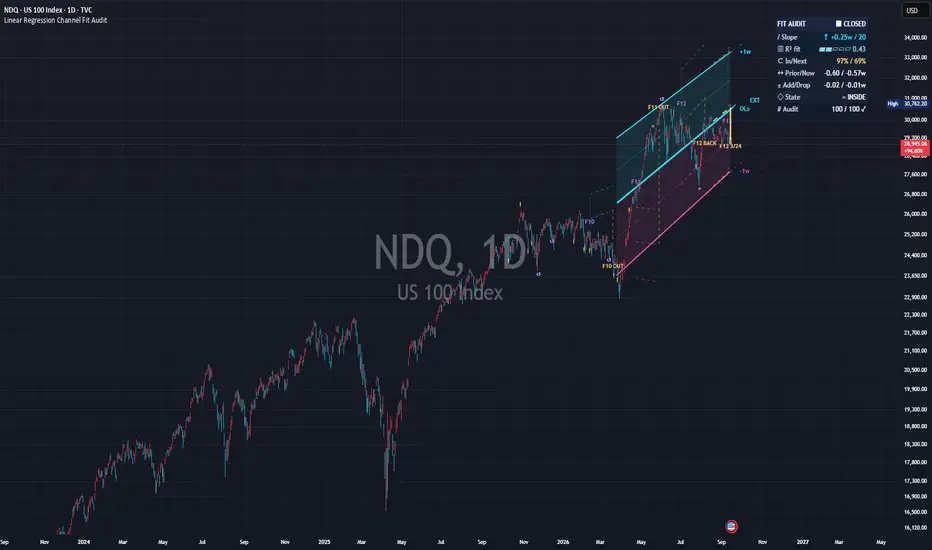
Linear Regression Channel
Visualizes the price tendency with a regression line ± width.
ForTraders who want a statistical slope
Oscillators / Momentum
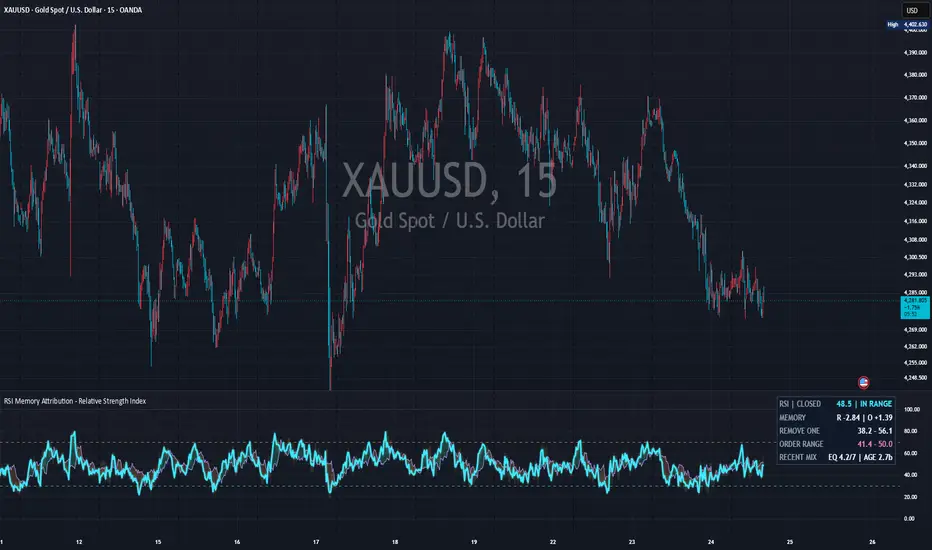
5 toolsRSI (Relative Strength Index)
Shows overbought / oversold conditions on a 0–100 scale.
ForTraders who want over-extension as a number
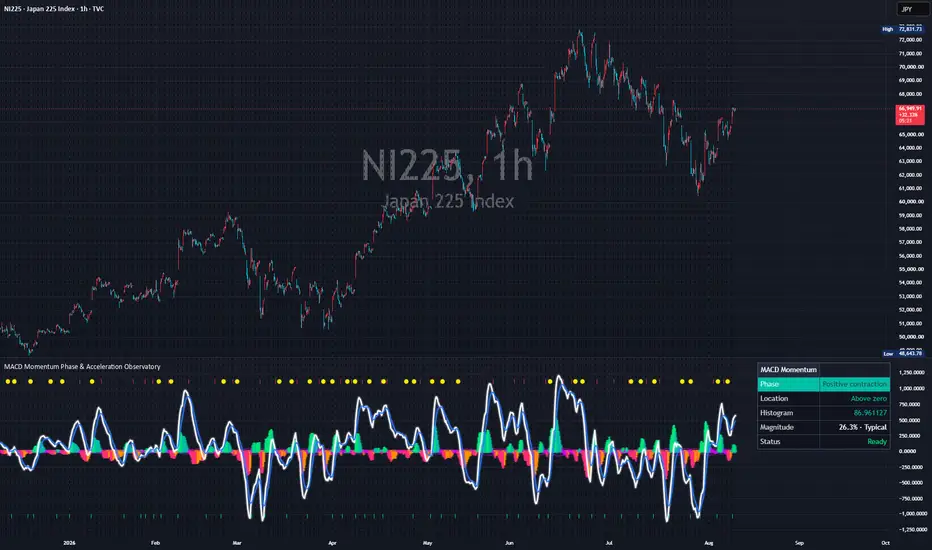
MACD
Displays the moving-average spread and a signal line.
ForTraders watching momentum shifts
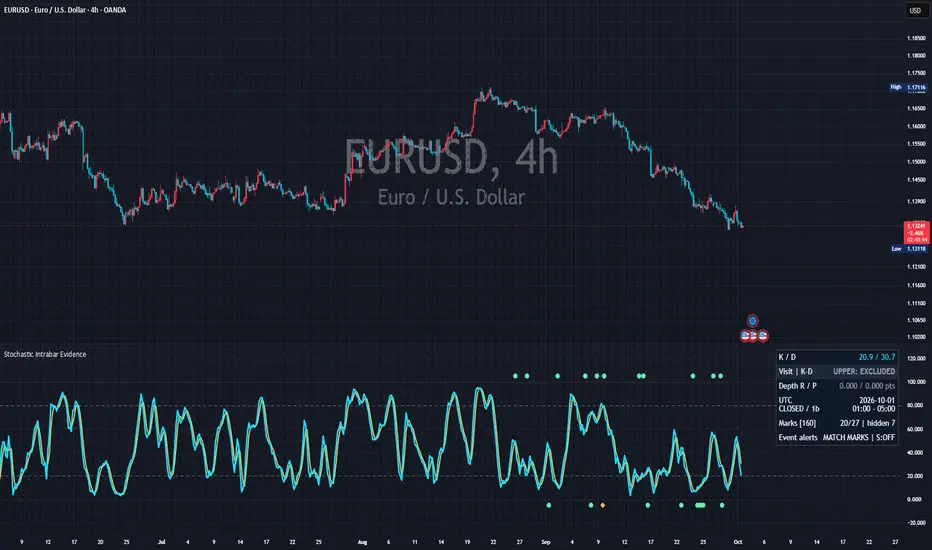
Stochastics
Shows the relative price position within a set period.
ForTraders gauging position within a range
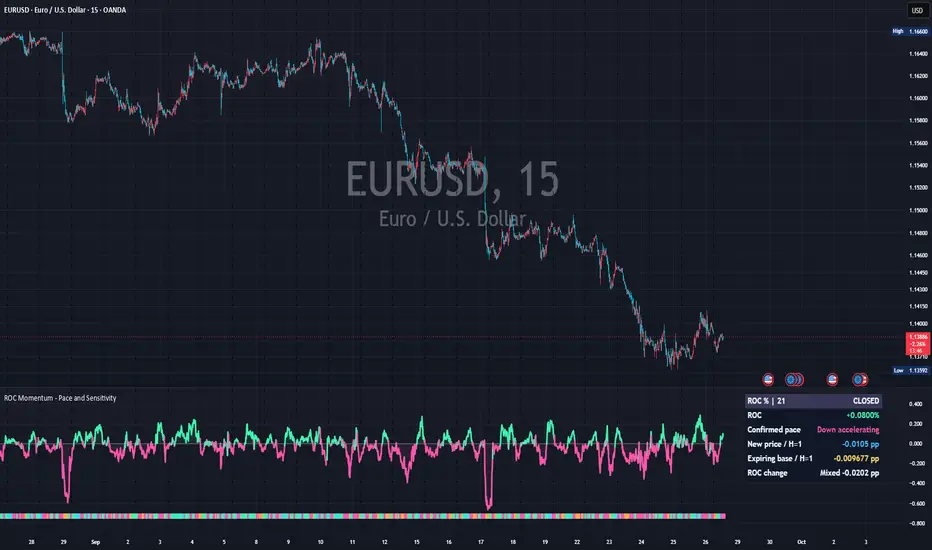
Momentum / ROC
Shows the strength of moves via rate of change.
ForTraders watching momentum accelerate or fade
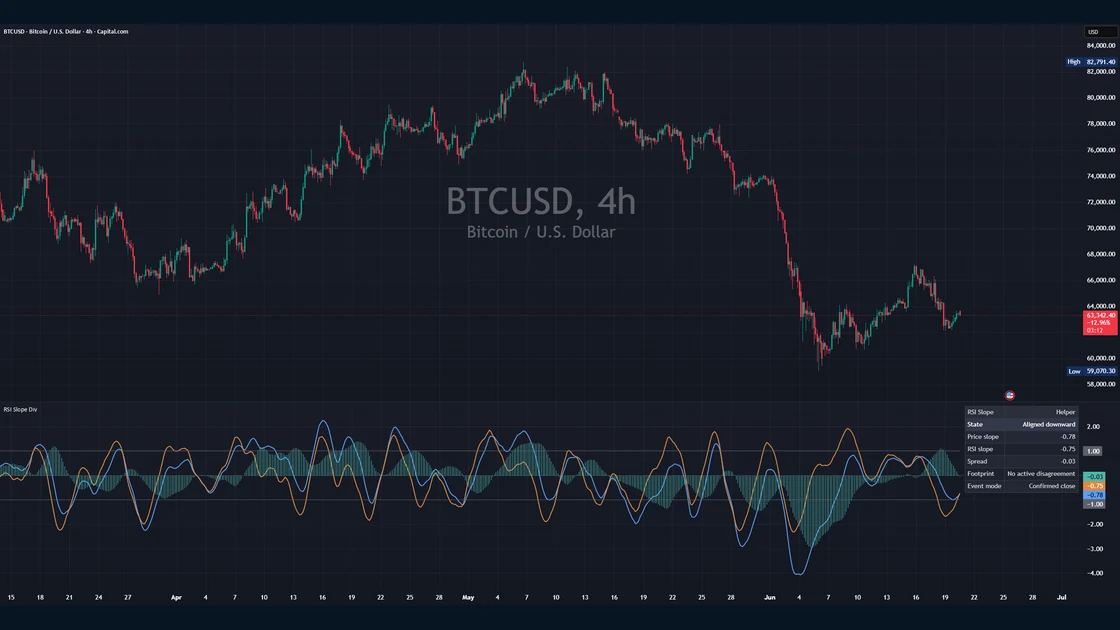
RSI Divergence Helper
Normalizes the rolling slope of price and the rolling slope of RSI and plots the difference between them as a spread histogram. Rather than a classic pivot-divergence detector, it frames slope agreement and disagreement as neutral states (aligned up or down, upper or lower disagreement, flat, mixed). A Divergence Footprint layer (episode duration, peak spread, expansion and phase gap) plus a compact dashboard make it a context tool for reading divergence between price and momentum.
ForTraders checking for divergence
Price structure / Levels
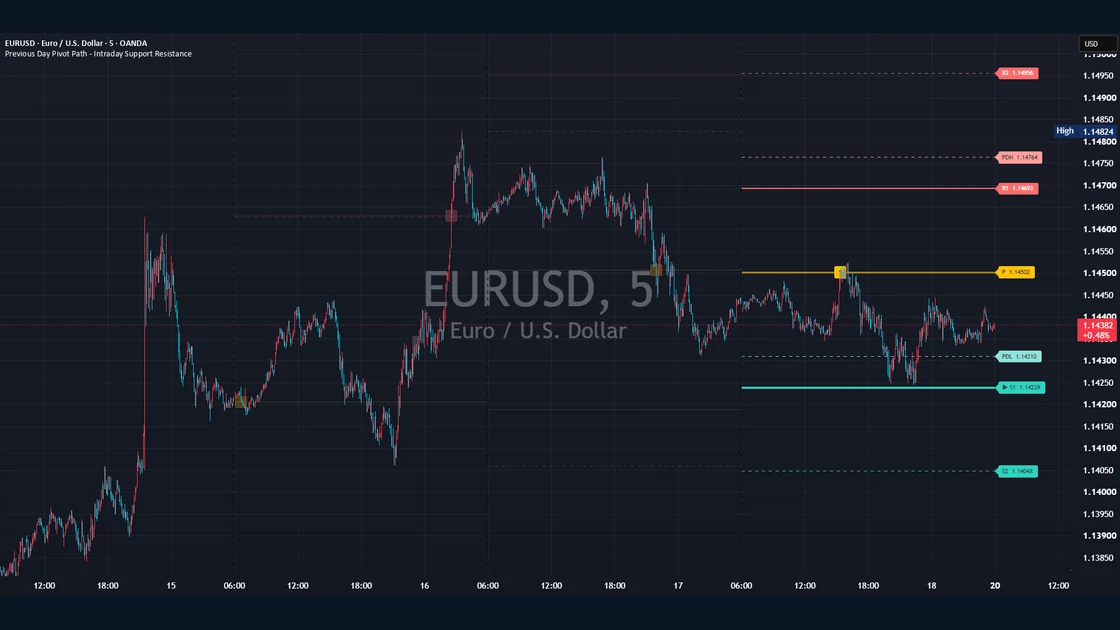
5 toolsPrevious Day Pivot Path – Intraday Support Resistance
Built for intraday charts, this study calculates the current day’s central pivot and support/resistance levels from the confirmed OHLC values of the previous selected trading day, then records the first chart bar to reach each level and assigns an arrival rank. It supports five formula families, wick/body/confirmed-close arrival definitions, reached-level fading, emphasis on the nearest unreached level, and optional context such as CPR and previous-day references. It is a neutral visualization and research tool for mathematically derived daily levels and their arrival path, not a source of trade signals or predictions.
ForIntraday traders and researchers who want to track previous-day pivot levels, first-arrival order, and the nearest unreached reference level
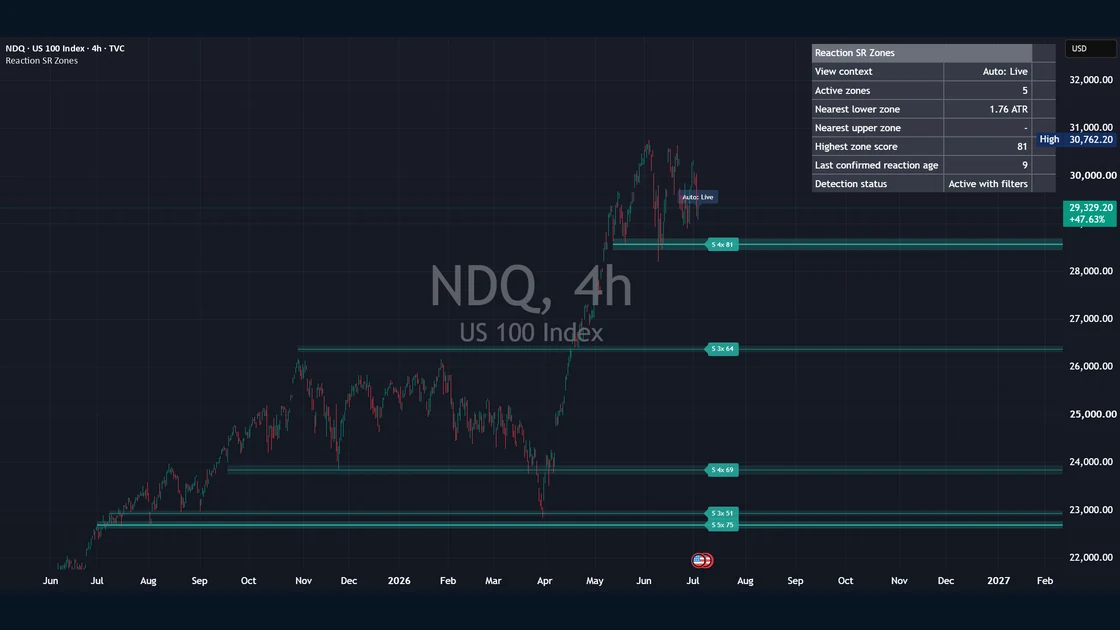
Reaction Based Support and Resistance Zones
Treats confirmed pivot highs and pivot lows as reaction events and clusters nearby reactions into horizontal reaction zones. Each zone is scored from touch count, freshness, ATR-normalized reaction strength and a width penalty, and labelled with a neutral state — support-like, resistance-like, mixed or inactive. It also plots local reaction levels for historical study, a context dashboard and alerts for confirmed reaction-zone events. It does not generate trading signals or provide entries, exits, targets or stops — the zones are historical reaction context, a visual price-action study tool, not predictions.
ForTraders doing visual price-action research who want support/resistance as historical reaction context
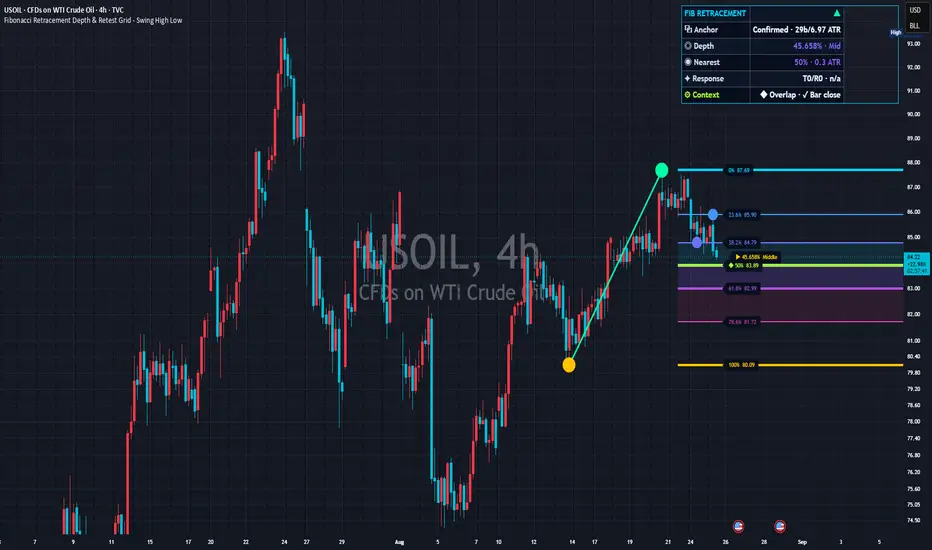
Fibonacci Retracement Helper
Displays key ratios from a high and low.
ForTraders judging pullback and continuation levels
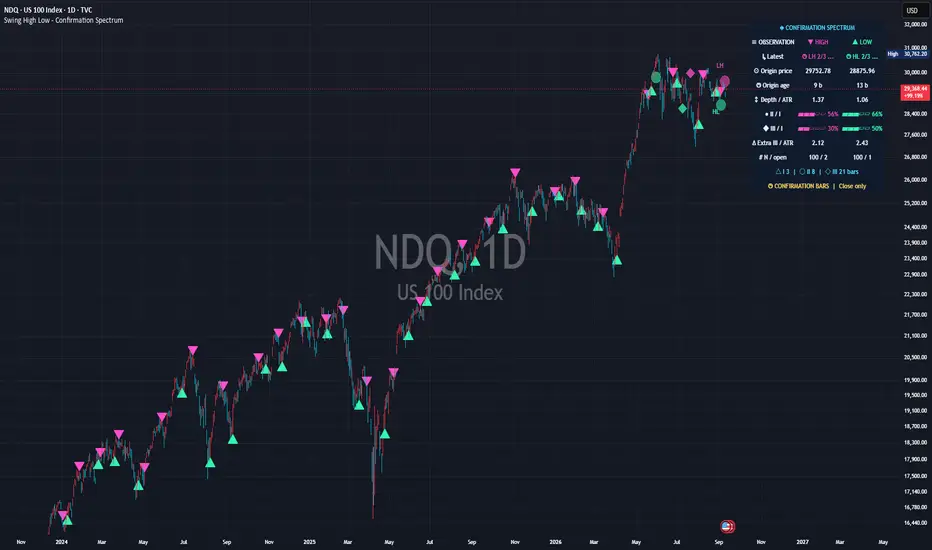
Swing High / Low Markers
Automatically marks recent swing points.
ForTraders spotting wave tops and bottoms
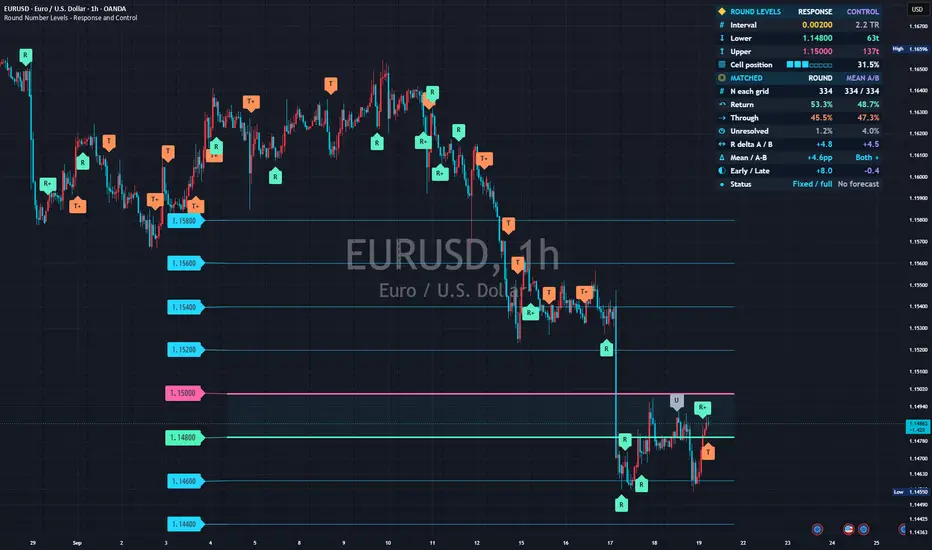
Round Numbers
Plots psychological round-number levels at even intervals.
ForTraders mindful of round numbers
Volume / Market internals
4 toolsVolume Profile (Lite)
Shows volume distribution by price band as horizontal bars.
ForTraders looking for high-volume price areas
Relative Volume
Shows how strong volume is versus normal.
ForTraders spotting unusual volume
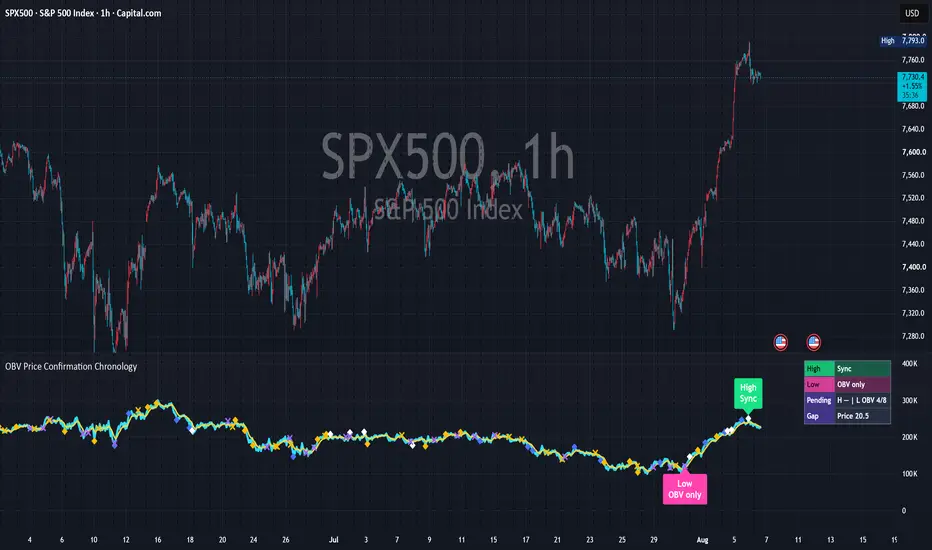
OBV (On-Balance Volume)
Shows the flow of money via cumulative volume.
ForTraders checking price/volume agreement
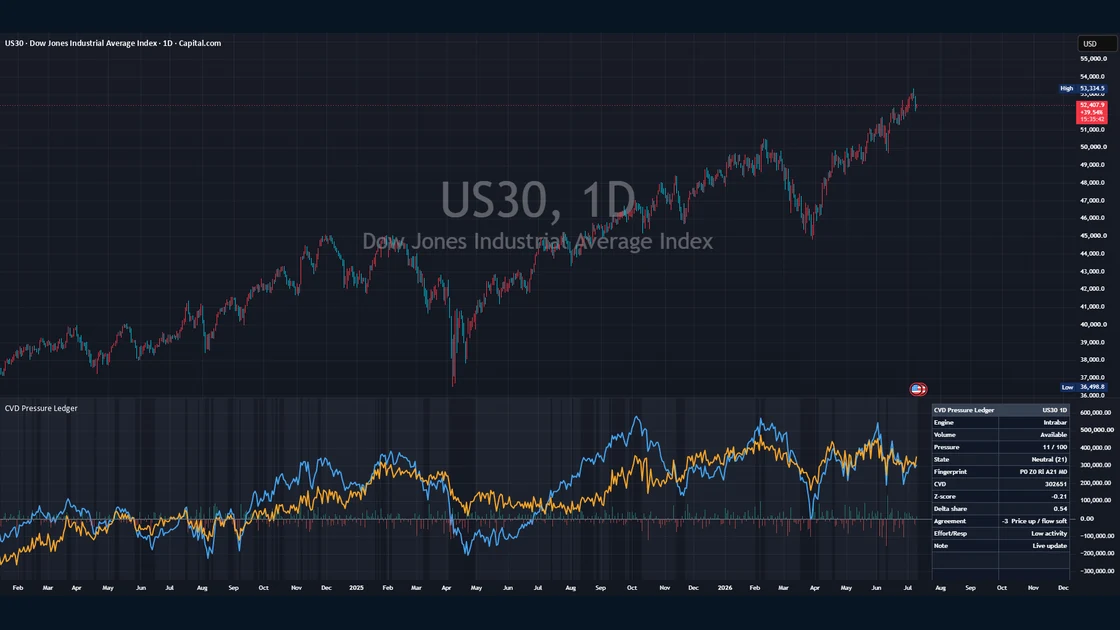
CVD Pressure Ledger – Cumulative Volume Delta Flow
A reset-aware cumulative volume delta (CVD) framework that layers a CVD line, CVD candles, a bar-by-bar delta histogram, a pressure-score line and a compact ledger table. It derives contextual metrics — CVD z-score, percentile, delta-share normalization, pressure-persistence age and an effort-versus-response classification — and combines CVD slope, delta share, z-score and persistence into a −100 to +100 pressure score, plus a compact “ledger fingerprint” that summarizes the current state. It is a context and visualization tool, not a trading system: it does not generate buy/sell signals or provide entries, exits, targets or stops — it visualizes the slope of supply/demand pressure as context. Delta figures are approximations when the selected data source or lower-timeframe information is unsuitable.
ForTraders who want to read the slope of supply/demand pressure, volume imbalance, price-flow agreement and effort-versus-response context

Risk management / Tools
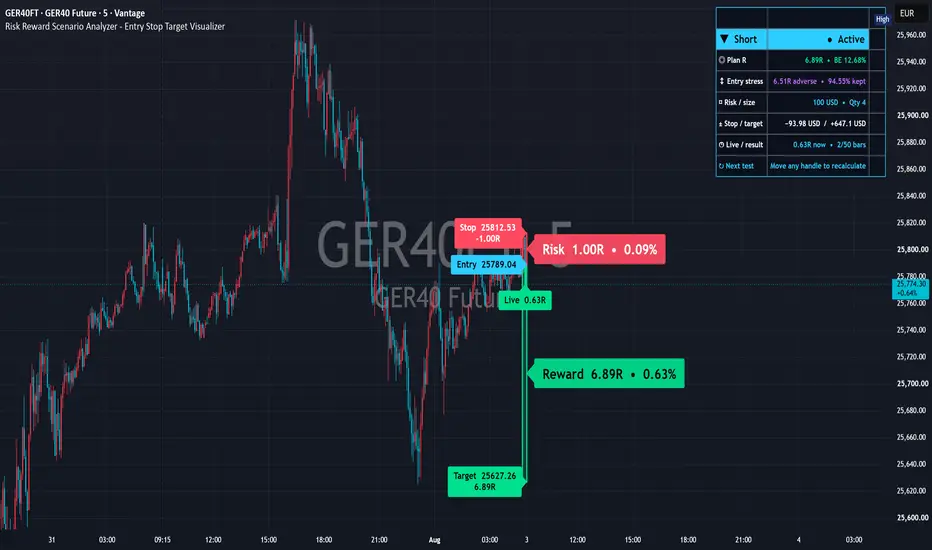
4 toolsRisk/Reward Visualizer
Boxes the R:R from your intended entry, stop and target.
ForTraders who want to see the payoff ratio
Position Size Helper
Shows a rough order quantity from your accepted risk.
ForTraders checking a quantity estimate
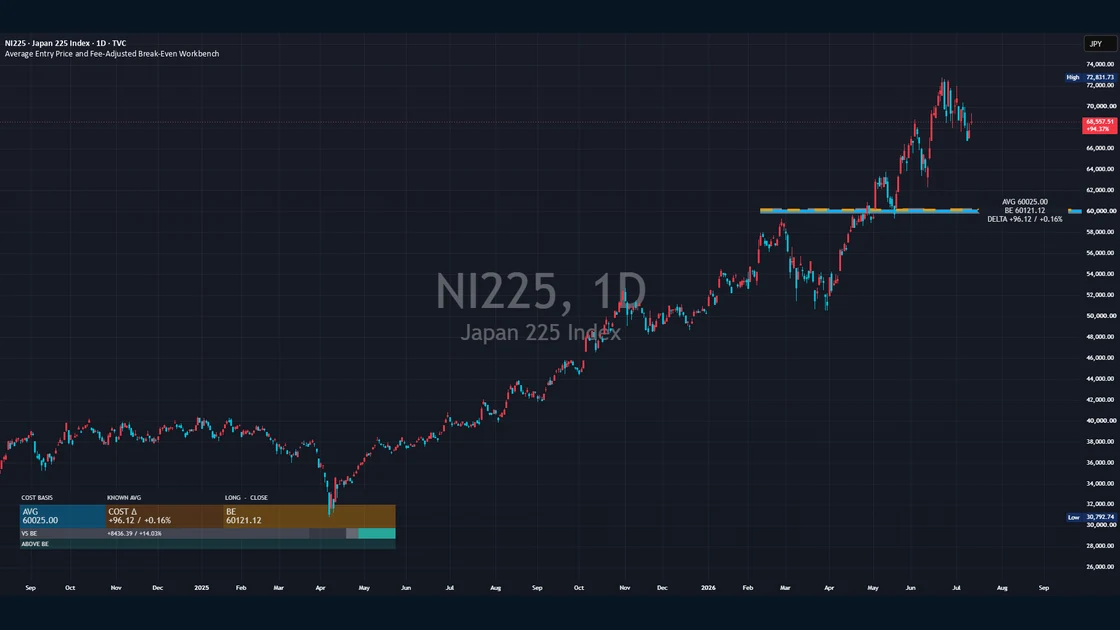
Average Entry Price and Fee-Adjusted Break-Even Workbench
An open-source position cost-basis and break-even research indicator. It reconstructs a manually entered position’s average entry price, weighted average cost and DCA cost basis, then calculates a cost- and fee-adjusted break-even level after configurable trading fees, spread or slippage, fixed costs and funding adjustments. It supports Long and Short positions and either a known average price or up to eight individual fills, plotting a cyan average-entry line, an orange dashed break-even line and the shaded Cost Gap between them. A compact panel sums up AVG (weighted average entry), COST Delta (cost impact between average and break-even), BE (cost-adjusted break-even) and VS BE (price distance from break-even), alongside Campaign Recovery, Next Fill and Target Calculation scenarios and fill-concentration statistics. It does not predict market direction, generate trade recommendations, read broker positions or place orders — an arithmetic, input-driven visualization and research tool whose output depends on the accuracy of your inputs.
ForTraders who want to visualize and research a fee- and cost-adjusted break-even and average entry price from manually entered positions
Time Alert Marker
Draws a vertical line at a time you specify.
ForTraders who don’t want to miss a time
02 — Related pages
Explore other pages
Try our free, no-sign-up lot-size calculator, or browse the MetaTrader edition of these free indicators.
Free lot-size calculator
Open the lot calculator
Enter your accepted risk and stop distance, and instantly get the optimal order size (lots). Free, no sign-up, and it runs right in your browser — handy for sizing risk before you trade.
Open the calculator Coming soon MTMetaTrader free indicators
MetaTrader free list
A list of free indicators for MT4 / MT5. It will be available here as soon as it’s ready. We’re also preparing more handy tools for trading, and we’ll publish them here one by one as each is finished.
Open the MetaTrader list03 — Contact
Contact
Questions about setting a tool up, or a bug to report? Feel free to get in touch.
- Contact form
- https://sggroup.jp/contact/
- contact@sggroup.jp
- Desk
- SG Group · Financial Analysis Tools Desk
- Response hours
- Weekdays 10:00 – 18:00 (JST) / Standard reply target within 2 business days