

What it visualizes
Normalized price and RSI slope lines, spread histogram, zero/threshold guides, optional tint, phase-gap line, duration columns, P+ R− / P− R+ / Align markers and a context dashboard.
FreeOpen sourcePine Script v6
Estimate rolling regression slopes for price and RSI, normalize each by its own standard deviation, then compare agreement, spread, duration, peak and Expanding/Cooling/Holding footprint. This is not a pivot-divergence detector.
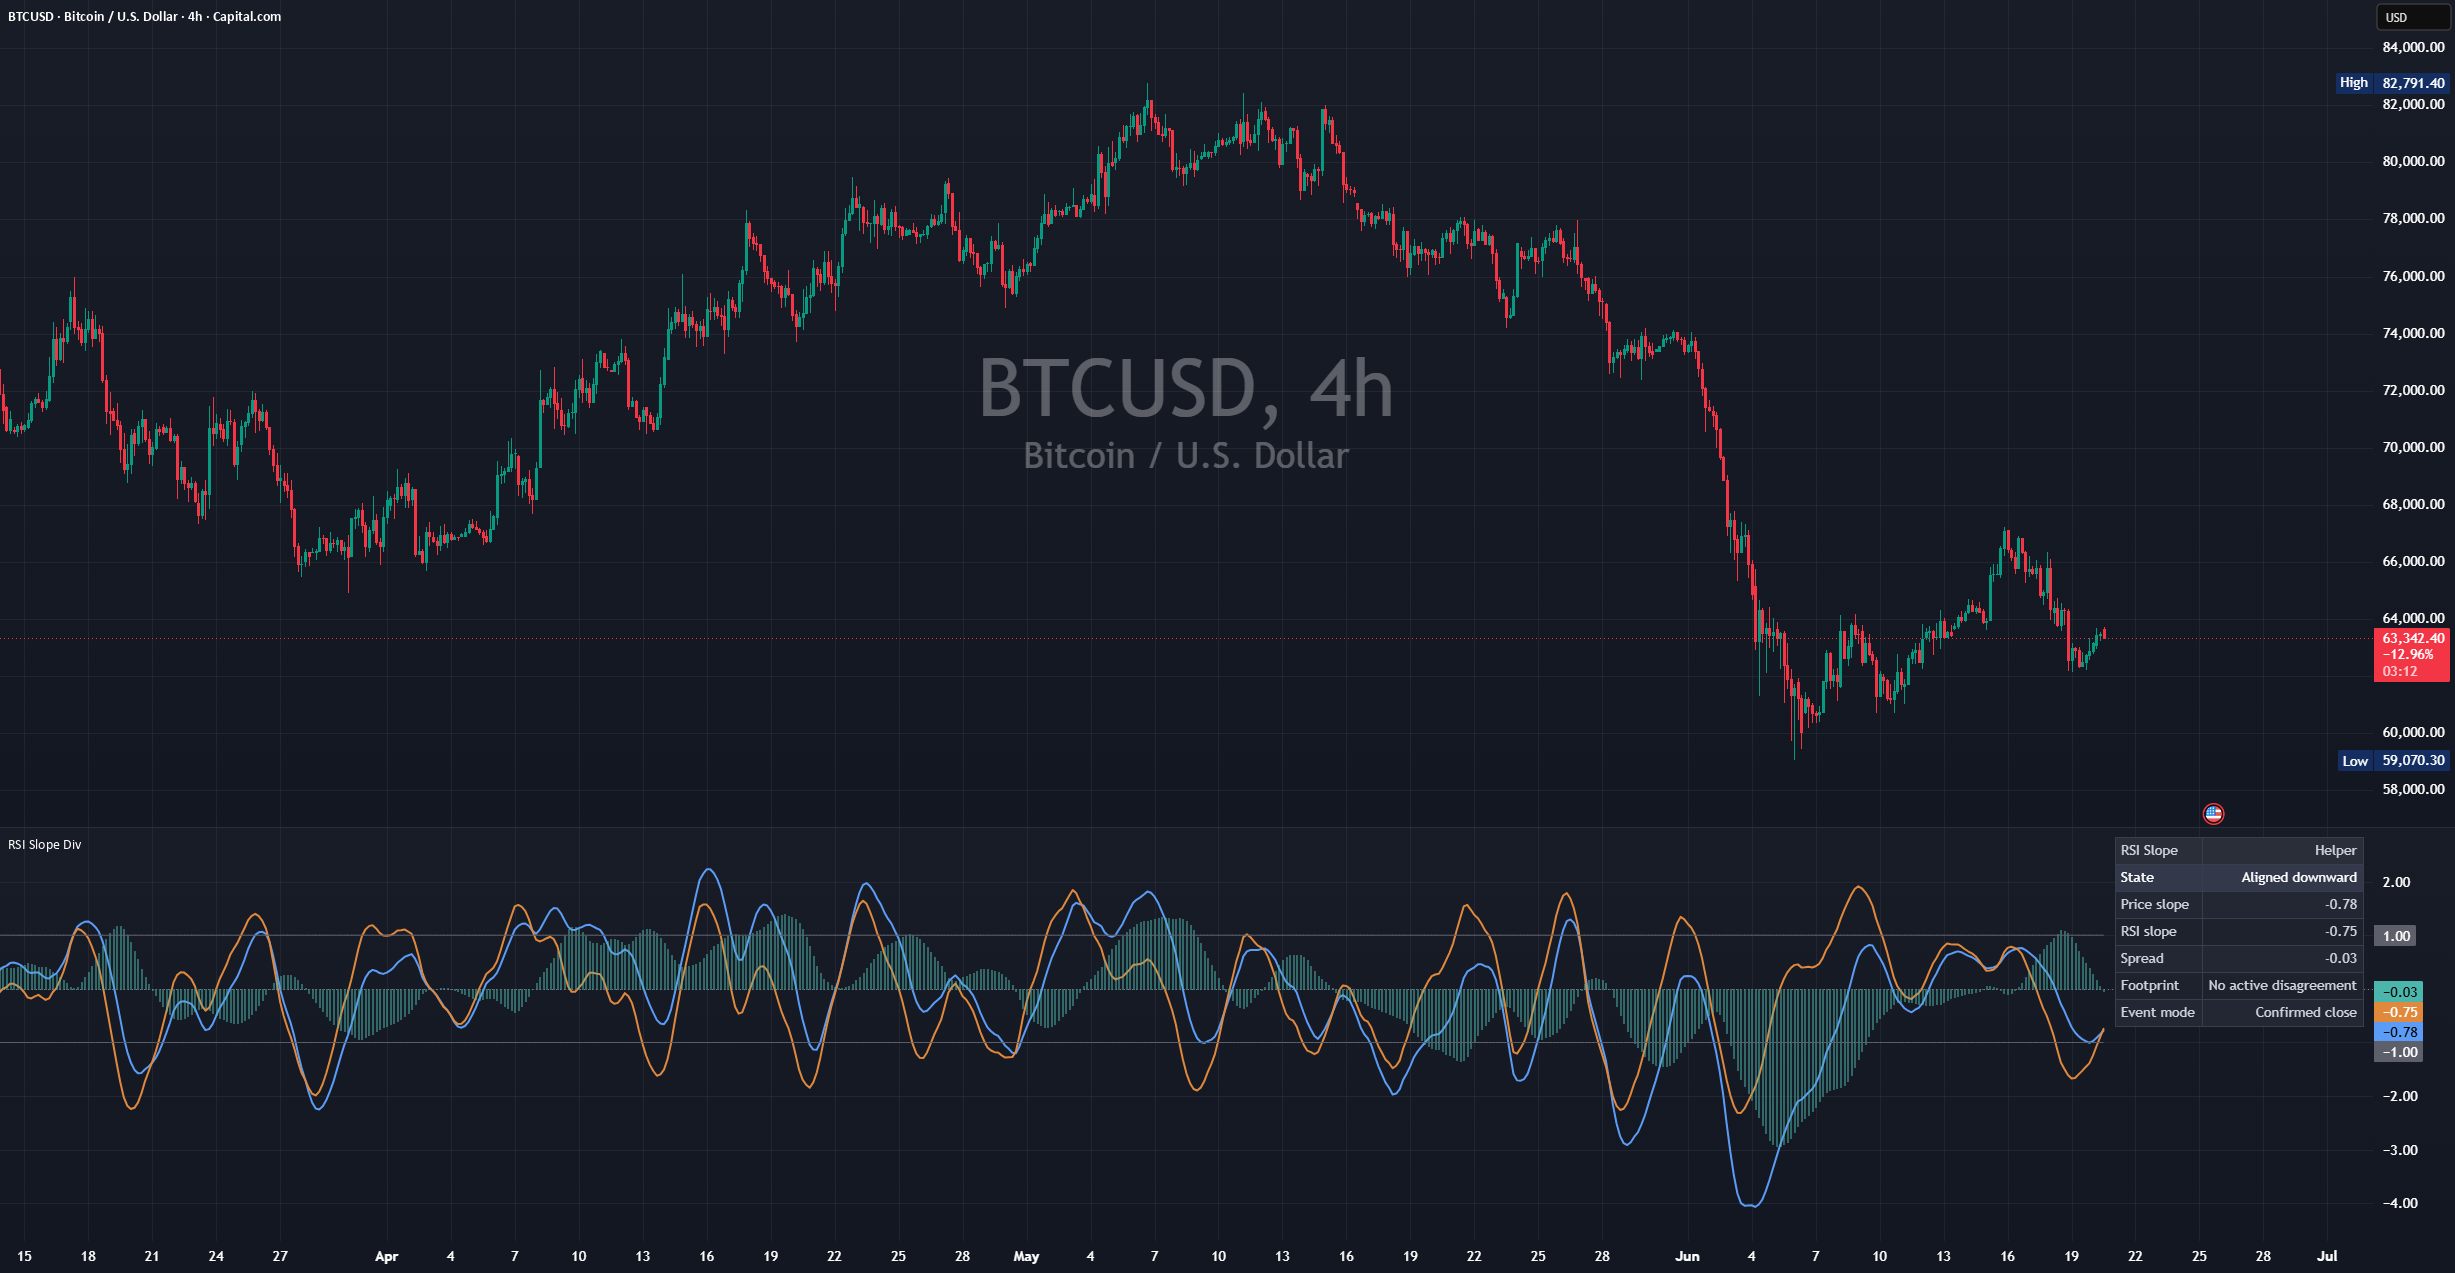
Price regression slope is expressed in price percent and RSI regression slope in RSI points. Because the units differ, each is divided by its own rolling standard deviation. Spread is normalized price slope minus normalized RSI slope, and sign disagreement plus a magnitude floor defines State.
Normalized price and RSI slope lines, spread histogram, zero/threshold guides, optional tint, phase-gap line, duration columns, P+ R− / P− R+ / Align markers and a context dashboard.
Upper disagreement means positive price slope with negative RSI slope; Lower is the reverse. Footprint tracks duration, peak absolute spread, Expanding/Cooling/Holding motion and an arctangent-based phase gap.
Price-percent slope and RSI-point slope are scaled by their own rolling standard deviations before comparison.
Upper and Lower require opposite slope signs beyond the minimum normalized magnitude.
Forming, Expanding, Cooling and Holding plus duration, peak and phase gap describe the disagreement through time.
Add the public script to a chart and identify every drawing in the default configuration first. Change only one input at a time.
Open the public RSI Slope Divergence Helper page and add it to a TradingView chart. No SG Group account is required.
Overlapping lines, bands, backgrounds or tables can be duplicate drawings of the same kind of information. Never treat visual overlap by itself as stronger evidence or signal agreement. Even in a separate pane, built-in RSI, another divergence histogram, background tint and a state table can duplicate zero lines, thresholds, colors and markers.
Do not turn one value or color into a conclusion. Check the condition, persistence and relationship to price in order.
Check sign and magnitude of price slope and RSI slope before the spread.
Small slopes remain Flat / low slope so a tiny difference is not treated as disagreement.
Expanding can persist; Cooling can disappear without a large price move.
Price and RSI slopes share direction; continuation is not guaranteed.
Positive price slope and negative RSI slope; not a bearish reversal forecast.
Negative price slope and positive RSI slope; not a bullish reversal forecast.
Slopes are too small or do not fit a clear state.
Start, widening, narrowing or little change in the disagreement episode.
Angle-like separation of transformed slopes, not probability or confidence.
The labels below match the published script’s English Inputs panel. Defaults reflect the public source at the time of review and may change in a later TradingView update.
On small screens, each input is reformatted as a readable stacked card.
| Input label | Default / options | What it controls and when to adjust it |
|---|---|---|
Price source | close | Selects the source series for the price regression slope. |
RSI source | close | Selects the source series used to calculate RSI. |
RSI length | 14 | min: 2 | Sets the RSI calculation length. |
Slope length | 21 | min: 2 | Sets the rolling regression window for price and RSI slopes. |
Normalization length | 100 | min: 5 | Sets the rolling standard-deviation window used to normalize each slope. |
Smoothing length (display) | 3 | min: 1 | Smooths the normalized slopes for display. |
Minimum bars before classification | 100 | min: 0 | Sets the minimum number of bars required before state classification. |
Use automatic warm-up floor | true | Automatically extends warm-up to cover all active calculation lengths. |
| Input label | Default / options | What it controls and when to adjust it |
|---|---|---|
Minimum normalized slope magnitude | 0.35 | min: 0 | step: 0.05 | Sets the minimum absolute normalized slope treated as directional. |
Disagreement threshold | 1.0 | min: 0 | step: 0.05 | Sets the spread-strength filter and the positive/negative guide level. |
Spread motion threshold | 0.05 | min: 0 | step: 0.01 | Sets the minimum one-bar absolute-spread change classified as Expanding or Cooling. |
Disagreement event filter | Direction + spread threshold | options: Direction only, Direction + spread threshold | Chooses whether events require direction alone or direction plus the spread threshold; the state is unchanged. |
| Input label | Default / options | What it controls and when to adjust it |
|---|---|---|
Marker display mode | Off | options: Off, Disagreement only, All events | Chooses no markers, disagreement markers only, or all events including Align. |
Show agreement-restored marker | false | Shows an Align marker when same-direction agreement returns after disagreement in All events mode. |
Confirm events on bar close | true | Confirms events only at bar close; disabling it permits intrabar changes. |
Minimum disagreement bars for event | 1 | range: 1–20 | Sets the consecutive qualified-disagreement bars required before an event. |
Event cooldown bars | 0 | range: 0–50 | Sets bars to wait before another event; it does not change the table state. |
Show realtime status in table | true | Shows the current bar's Confirmed or Realtime status in the table. |
| Input label | Default / options | What it controls and when to adjust it |
|---|---|---|
Show footprint table rows | true | Shows Footprint-related rows in Standard and Detailed layouts. |
Show compact footprint row | true | Shows the Footprint row in the Compact layout. |
Show phase gap line | false | Shows a scaled line for the angular phase gap between the two slopes. |
Show episode duration plot | false | Plots the current disagreement episode duration as columns. |
Phase gap scale divisor | 45.0 | min: 1 | step: 1 | Scales the phase-gap line for the pane without changing the underlying value. |
Phase gap line color | #9B7FD5 | Sets the phase-gap line color. |
Disagreement bars color | #6B7280 | Sets the disagreement-duration column color. |
| Input label | Default / options | What it controls and when to adjust it |
|---|---|---|
Show helper lines | true | Shows the normalized price-slope and RSI-slope helper lines. |
Show spread histogram | true | Shows the histogram of normalized price slope minus normalized RSI slope. |
Show background tint | false | Tints the background during Upper or Lower disagreement. |
Show threshold guides | true | Shows the zero and positive/negative disagreement-threshold guides. |
| Input label | Default / options | What it controls and when to adjust it |
|---|---|---|
Show dashboard table | true | Shows the state dashboard table. |
Table layout | Compact | options: Compact, Standard, Detailed | Selects the dashboard's information density. |
Table position | Top right | options: Top left, Top center, Top right, Middle left, Middle center, Middle right, Bottom left, Bottom center, Bottom right | Selects the dashboard position on the chart. |
Dashboard text size | Normal | options: Tiny, Small, Normal, Large | Selects the dashboard body-text size. |
Header text size | Normal | options: Tiny, Small, Normal, Large | Selects the dashboard header-text size. |
Use fixed table cell sizing | false | Applies the manual column widths and row heights below instead of automatic sizing. |
Label column width | 0 | range: 0–100 | Sets the fixed label-column width; zero keeps it automatic. |
Value column width | 0 | range: 0–100 | Sets the fixed value-column width; zero keeps it automatic. |
Row height | 0 | range: 0–20 | Sets the fixed body-row height; zero keeps it automatic. |
Header row height | 0 | range: 0–20 | Sets the fixed header-row height; zero keeps it automatic. |
Table frame width | 1 | range: 0–5 | Sets the dashboard outer-frame width. |
Table border width | 1 | range: 0–5 | Sets the dashboard cell-border width. |
Use alternating row background | true | Alternates row backgrounds for readability. |
Highlight current state row | true | Highlights the current State row. |
Show bar status in compact layout | false | Adds the Bar status row to the Compact layout. |
| Input label | Default / options | What it controls and when to adjust it |
|---|---|---|
Price slope line color | #5B9CF6 | Sets the normalized price-slope line color. |
RSI slope line color | #E0883C | Sets the normalized RSI-slope line color. |
Spread color | #4DB6AC | Sets the base spread-histogram color. |
Upper disagreement color | #D98880 | Sets the highlight color for positive price slope and negative RSI slope. |
Lower disagreement color | #7FB3D5 | Sets the highlight color for negative price slope and positive RSI slope. |
Zero line color | #787B86 | Sets the zero-guide color. |
Threshold line color | #5D606B | Sets the positive and negative threshold-guide color. |
Marker color | #B2B5BE | Sets the event-marker background color. |
Marker text color | #D1D4DC | Sets the event-marker text color. |
Table header background | #2A2E39 | Sets the table-header background color. |
Table cell background | #1E222D | Sets the table-cell background color. |
Table alternate row background | #232733 | Sets the alternate-row background color. |
Table state highlight background | #33384A | Sets the State-row highlight background color. |
Table text color | #D1D4DC | Sets the table body-text color. |
Table state text color | #FFFFFF | Sets the State-row text color. |
Table header text color | #D1D4DC | Sets the table-header text color. |
Table border color | #3A3E4A | Sets the table cell-border color. |
Table frame color | #3A3E4A | Sets the table outer-frame color. |
Histogram transparency | 50 | range: 0–100 | Sets spread-histogram transparency. |
Background tint transparency | 90 | range: 0–100 | Sets disagreement background-tint transparency. |
Marker transparency | 0 | range: 0–100 | Sets event-marker transparency. |
Header background transparency | 0 | range: 0–100 | Sets header-background transparency. |
Cell background transparency | 0 | range: 0–100 | Sets cell-background transparency. |
Alternate row transparency | 0 | range: 0–100 | Sets alternate-row background transparency. |
State highlight transparency | 0 | range: 0–100 | Sets State-row highlight transparency. |
Alerts are state, touch or transition events defined in the public source. They are not trade instructions.
This tool is for analysis and visualization. It is not investment advice, a trade recommendation, a forecast, or a promise of profit or accuracy. Results depend on inputs, symbol, timeframe, and data feed. You remain responsible for every trading decision.
It compares rolling slopes, not confirmed swing highs and lows.
Upper is not automatically bearish and Lower is not automatically bullish. Disagreement can persist or resolve.
RSI, slope, normalization and smoothing lengths plus thresholds materially change sensitivity. Defaults are not optimized.
Do not convert Upper or Lower into trade direction. Price slope, RSI slope, Spread and Footprint are related outputs from the same two series, not four independent votes.
Clarify the difference from pivot divergence, non-directional Upper/Lower labels, normalization and Footprint.
Yes. It is a free, open-source indicator published by SG Group on TradingView. Review TradingView’s terms and the conditions attached to the public script before reuse or redistribution.
Start with the published defaults and observe the drawings and state changes first. Then change one input at a time for the symbol, timeframe and data feed so you can identify what caused each visual change.
Yes, but similar lines, bands, backgrounds and tables can overlap and obscure their source. Isolate each indicator first and hide duplicate components. Visual overlap alone is not stronger evidence or signal agreement.
No. It is analysis and visualization context consistent with the public description. It does not provide entries, exits, targets, stops, price forecasts, or promises of profit, win rate or accuracy.
No. It is positive rolling price slope with negative rolling RSI slope, not a confirmed pivot-high divergence pattern, and it does not predict a reversal.
This guide is grounded in SG Group’s live catalogue, the script’s published TradingView description, and the user-facing inputs in its open source. Labels and defaults can change after a script update.