

What it visualizes
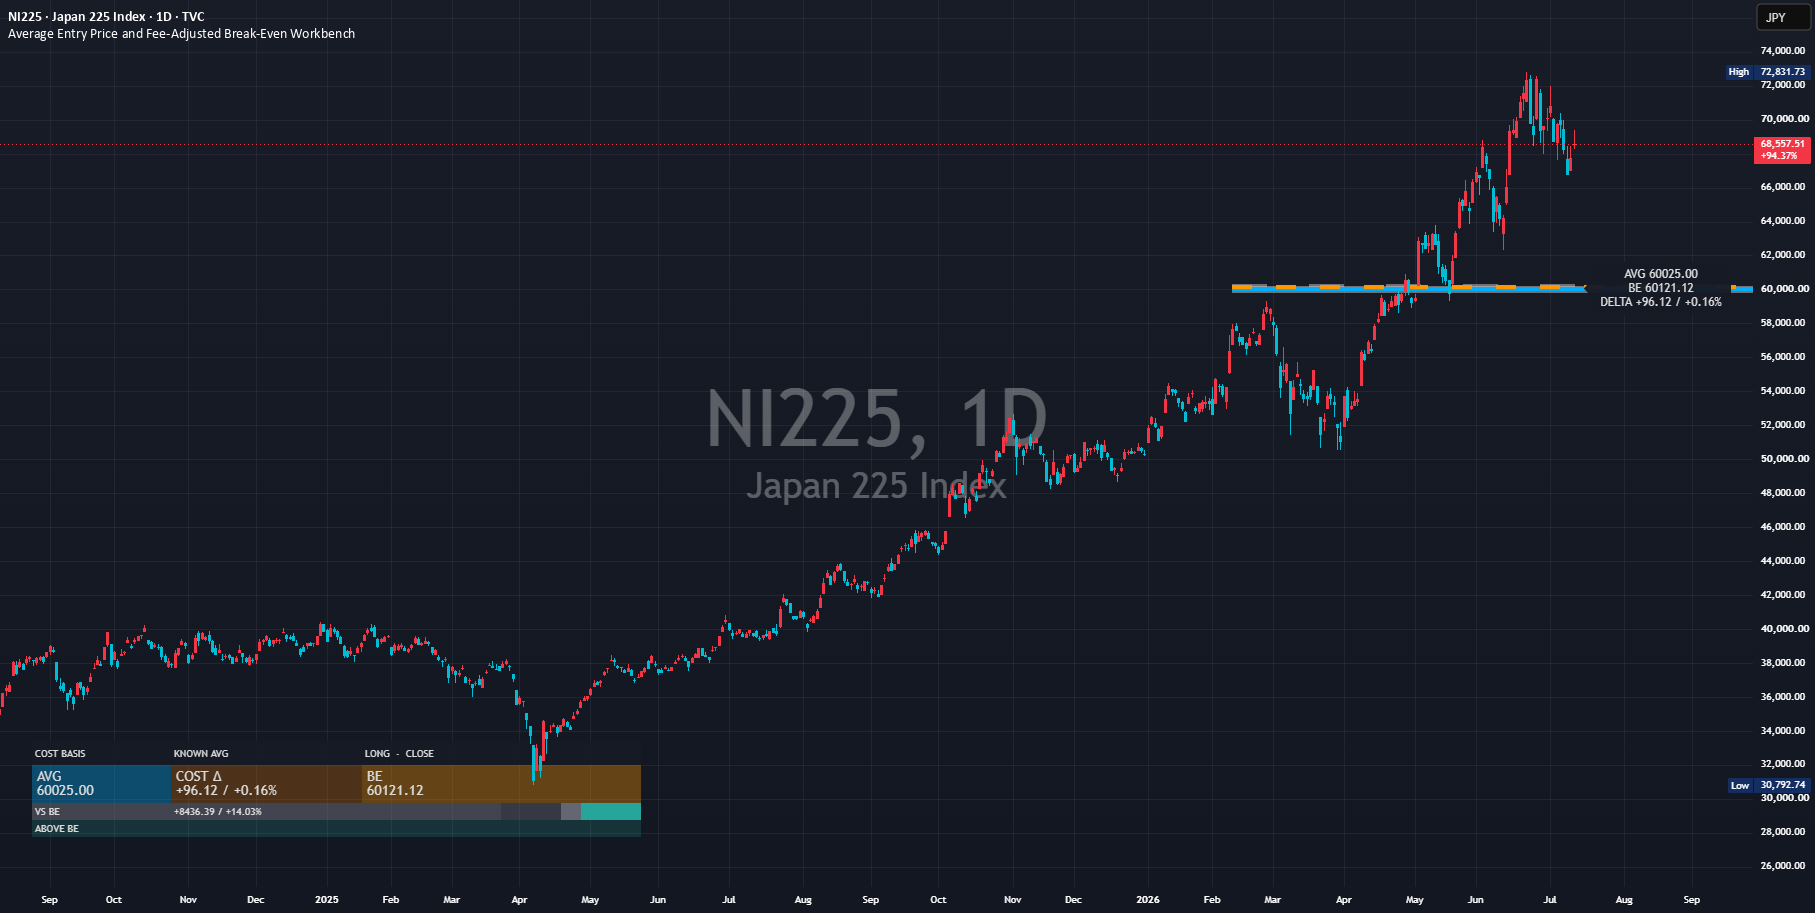
Cyan solid AVG, orange dashed break-even, the Cost Gap between them, optional fill markers and historical paths, a position panel, and Campaign Recovery, Next Fill and Target Calculation scenarios.
FreeOpen sourcePine Script v6
Reconstruct quantity-weighted AVG from a known average or up to eight individual fills, then include entry and exit fees, exit friction, fixed costs, carry or funding, and other cost or credit in a fee-adjusted break-even.
Weighted Average divides total fill-price times quantity by total quantity. Direction-specific equations apply fees and friction, then displayed long break-even rounds upward and short break-even downward to the minimum tick. The current public interface is English-only with no Language input.
Cyan solid AVG, orange dashed break-even, the Cost Gap between them, optional fill markers and historical paths, a position panel, and Campaign Recovery, Next Fill and Target Calculation scenarios.
PRICE ONLY uses percentage fees and price friction. FULL CASH uses a valid point value to convert fixed, carry and other cash costs and P&L. Cash costs without point value produce POINT VALUE NEEDED, and a failed residual health check suppresses break-even output.
Individual fills sum valid price times Qty and divide by total Qty. With dated fills, each row activates only after its Fill time.
Entry and exit fees, exit friction and per-unit cash cost enter separate long and short net equations. The result is substituted back into the same equation for a residual check.
Campaign Recovery applies realized P&L, Next Fill adds a hypothetical fill, and Target Calculation solves added Qty for a requested AVG or break-even. It is not recommended size.
Add the public script to a chart and identify every drawing in the default configuration first. Change only one input at a time.
Open the public Average Entry Price and Fee-Adjusted Break-Even Workbench page and add it to a TradingView chart. No SG Group account is required.
Overlapping lines, bands, backgrounds or tables can be duplicate drawings of the same kind of information. Never treat visual overlap by itself as stronger evidence or signal agreement. A broker average-price line, TradingView position drawing or another break-even or fee calculator can duplicate AVG, break-even and Cost Gap. Historical paths, Campaign break-even, Next Fill break-even and target scenarios can also be mistaken for the current break-even.
Do not turn one value or color into a conclusion. Check the condition, persistence and relationship to price in order.
Identify KNOWN AVG or FILLS, LONG or SHORT, Quantity, and any Insufficient input or No active position state.
Read PRICE ONLY, FULL CASH or POINT VALUE NEEDED and confirm which fees, friction and cash costs are included.
Positive VS BE means the favorable side for either long or short; negative means unfavorable. Campaign, Next Fill and Qty required are separate hypothetical results.
Model using percentage fees and price friction without cash-cost conversion.
Model converting fixed, carry and other cash costs and P&L with a valid point value.
A valid point value is required to convert cash costs into price units.
Raw price location around break-even; use VS BE for direction-aware favorability.
Direction-aware VS BE is positive / negative.
Missing inputs / residual validation failed / no active position.
The labels below match the published script’s English Inputs panel. Defaults reflect the public source at the time of review and may change in a later TradingView update.
On small screens, each input is reformatted as a readable stacked card.
| Input label | Default / options | What it controls and when to adjust it |
|---|---|---|
[P1] Input method | Known average; Known average / Individual fills | Selects a known position average or reconstruction from individual fills. |
[P2] Position side | Long; Long / Short | Selects the long or short break-even equation and directional comparison. |
[P3] Average price | 0.0 | Sets the known average entry price; zero leaves the position undefined. |
[P4] Position quantity | 0.0; min 0, step 0.0001 | Sets the remaining open position quantity. |
| Input label | Default / options | What it controls and when to adjust it |
|---|---|---|
[C1] Entry fee (%) | 0.0; −50–50, step 0.001 | Sets the entry fee as a percentage of entry notional; negative values represent rebates. |
[C2] Exit fee (%) | 0.0; −50–50, step 0.001 | Sets the estimated exit fee as a percentage of exit notional. |
[C3] Exit friction (ticks) | 0.0; min 0, step 0.1 | Sets expected exit spread or slippage in minimum-tick units. |
[C4] Detailed cash costs | Off | Includes fixed, carry, and other cash costs in break-even calculations. |
[C5] Fixed entry cost per order | 0.0; min 0, step 0.01 | Sets the fixed entry cost per order parameter used by 02 – Costs – Optional. |
[C6] Entry orders | 1; min 0 | Sets the entry orders parameter used by 02 – Costs – Optional. |
[C7] Fixed exit cost | 0.0; min 0, step 0.01 | Sets the fixed exit cost parameter used by 02 – Costs – Optional. |
[C8] Carry / funding | 0.0; step 0.01 | Sets the carry / funding parameter used by 02 – Costs – Optional. |
[C9] Other cost or credit | 0.0; step 0.01 | Sets the other cost or credit parameter used by 02 – Costs – Optional. |
| Input label | Default / options | What it controls and when to adjust it |
|---|---|---|
[F1] Number of fills | 1; 1–8 | Selects how many of the eight fill rows participate in the calculation. |
[F2] Fill 1 | price 0.0 | Sets the execution price for fill 1. |
Qty | 0.0; min 0, step 0.0001 | Sets the quantity assigned to the corresponding fill row. |
[F3] Fill 2 | price 0.0 | Sets the execution price for fill 2. |
Qty | 0.0; min 0, step 0.0001 | Sets the quantity assigned to the corresponding fill row. |
[F4] Fill 3 | price 0.0 | Sets the execution price for fill 3. |
Qty | 0.0; min 0, step 0.0001 | Sets the quantity assigned to the corresponding fill row. |
[F5] Fill 4 | price 0.0 | Sets the execution price for fill 4. |
Qty | 0.0; min 0, step 0.0001 | Sets the quantity assigned to the corresponding fill row. |
[F6] Fill 5 | price 0.0 | Sets the execution price for fill 5. |
Qty | 0.0; min 0, step 0.0001 | Sets the quantity assigned to the corresponding fill row. |
[F7] Fill 6 | price 0.0 | Sets the execution price for fill 6. |
Qty | 0.0; min 0, step 0.0001 | Sets the quantity assigned to the corresponding fill row. |
[F8] Fill 7 | price 0.0 | Sets the execution price for fill 7. |
Qty | 0.0; min 0, step 0.0001 | Sets the quantity assigned to the corresponding fill row. |
[F9] Fill 8 | price 0.0 | Sets the execution price for fill 8. |
Qty | 0.0; min 0, step 0.0001 | Sets the quantity assigned to the corresponding fill row. |
| Input label | Default / options | What it controls and when to adjust it |
|---|---|---|
[R1] Campaign recovery | Off | Shows an alternative recovery break-even adjusted for realized profit or loss. |
[R2] Realized P&L | 0.0; step 0.01 | Sets realized profit or loss used by the optional campaign-recovery calculation. |
[R3] Next fill | Off | Enables a hypothetical next-fill break-even scenario. |
[R4] Next price | 0.0 | Sets the price used for next. |
[R5] Next quantity | 0.0; min 0, step 0.0001 | Sets the quantity used for next. |
[R6] Target calculation | Off | Enables the solver for a target average price or fee-adjusted break-even. |
[R7] Target type | Average price; Average price / Fee-adjusted Break-Even | Selects whether the solver targets average price or fee-adjusted break-even. |
[R8] Target price | 0.0 | Sets the price used for target. |
[R9] Additional fill price | 0.0 | Sets the price used for additional fill. |
| Input label | Default / options | What it controls and when to adjust it |
|---|---|---|
[D1] Layout | Overview; Clean / Minimal / Overview / Research / Custom | Selects a display preset for lines, bands, labels, history, and panels. |
[D2] Position Panel | Overview; Off / Compact / Overview / Detailed | Selects the amount of information shown in the position panel. |
[D3] Panel position | Bottom Left; Bottom/Top/Middle × Left/Right | Selects where the position panel is placed on the chart. |
[D4] Bottom-left clearance | Auto; Auto / Extra / Off | Controls transparent clearance around TradingView's lower-left interface. |
[D7] Contrast mode | Auto; Auto / High / Soft | Selects automatic, high, or soft chart-theme contrast. |
[D8] Label layout | Auto; Auto / Split / Combined / Right edge / Off | Selects how average and break-even labels are arranged. |
[D9] Show Current vs BE chart note | Off | Shows or hides current vs be chart note. |
[D10] Show setup guide | Off | Shows or hides setup guide. |
[D11] Panel meter range (%) | 1.0; 0.01–100, step 0.01 | Sets the panel meter range (%) parameter used by 05 – Display. |
[D12] Average color | #00b0ff | Sets the color used for average. |
[D13] Break-even color | #ff9800 | Sets the color used for break-even. |
[D14] Average width | 2; 1–5 | Sets the average width parameter used by 05 – Display. |
[D15] Break-even width | 3; 1–5 | Sets the break-even width parameter used by 05 – Display. |
[D16] Gap visibility | 10; 0–100 | Sets the gap visibility parameter used by 05 – Display. |
[D17] Label text color | white | Sets the color used for label text. |
[D18] Panel size | Small; Tiny / Small / Normal / Large | Sets the displayed size of text. |
[D19] Base label offset | 3; 0–400 | Sets the offset used for base label offset. |
[D20] Label lane spacing | 5; 1–30 | Sets the label lane spacing parameter used by 05 – Display. |
[D21] Minimum separation (ticks) | 8; 1–500 | Sets the minimum separation (ticks) parameter used by 05 – Display. |
[D22] Historical paths | Off | Sets the historical paths parameter used by 05 – Display. |
[D23] Fill markers | Off | Sets the fill markers parameter used by 05 – Display. |
[D24] Show Cost Gap label | Off | Shows or hides cost gap label. |
| Input label | Default / options | What it controls and when to adjust it |
|---|---|---|
[A1] Point value override | 0.0; 0–1e9, step 0.0001 | Overrides the symbol point value used for cash-cost and P&L conversion; zero uses automatic metadata. |
[A2] Fill validation | Require all selected rows; Require all selected rows / Use valid rows only | Selects whether every chosen fill row must be valid or only valid rows are used. |
[A3] Position timing | Current state; Current state / From start time | Selects whether the known position applies to all history or only after a start time. |
[A4] Position start time | 2024-06-03 00:00 UTC equivalent (1717372800000) | Sets when a known-average position becomes active in From start time mode. |
[A5] Current line span (bars) | 150; 10–5000 | Sets the current line span (bars) parameter used by 06 – Advanced. |
[A6] Use dated fills | Off | Activates each fill only after its assigned timestamp. |
[A7] Exit friction unit | Ticks; Ticks / Price units | Selects ticks or direct price units for detailed exit friction. |
[A8] Exit friction (price) | 0.0; min 0, step 0.0001 | Sets the exit friction (price) parameter used by 06 – Advanced. |
[A9] Fill 1 time | 2024-06-03 00:00 UTC equivalent | Sets the activation timestamp for fill 1 when dated fills are enabled. |
[A10] Fill 2 time | 2024-06-04 00:00 UTC equivalent | Sets the activation timestamp for fill 2 when dated fills are enabled. |
[A11] Fill 3 time | 2024-06-05 00:00 UTC equivalent | Sets the activation timestamp for fill 3 when dated fills are enabled. |
[A12] Fill 4 time | 2024-06-06 00:00 UTC equivalent | Sets the activation timestamp for fill 4 when dated fills are enabled. |
[A13] Fill 5 time | 2024-06-07 00:00 UTC equivalent | Sets the activation timestamp for fill 5 when dated fills are enabled. |
[A14] Fill 6 time | 2024-06-10 00:00 UTC equivalent | Sets the activation timestamp for fill 6 when dated fills are enabled. |
[A15] Fill 7 time | 2024-06-11 00:00 UTC equivalent | Sets the activation timestamp for fill 7 when dated fills are enabled. |
[A16] Fill 8 time | 2024-06-12 00:00 UTC equivalent | Sets the activation timestamp for fill 8 when dated fills are enabled. |
[A17] Panel price mode | Live price; Live price / Confirmed close | Selects live price or the last confirmed close for panel comparisons. |
[A18] Use current price on non-standard charts | Off | Allows synthetic-chart prices in Current vs BE calculations; alerts remain disabled. |
[A19] Visual separation lookback (bars) | 150; 10–1000 | Sets the visual separation lookback (bars) parameter used by 06 – Advanced. |
[A20] ATR separation factor | 0.20; 0–5, step 0.01 | Sets the atr separation factor parameter used by 06 – Advanced. |
[A21] Range separation (fraction) | 0.01; 0–1, step 0.001 | Sets the range separation (fraction) parameter used by 06 – Advanced. |
Alerts are state, touch or transition events defined in the public source. They are not trade instructions.
This tool is for analysis and visualization. It is not investment advice, a trade recommendation, a forecast, or a promise of profit or accuracy. Results depend on inputs, symbol, timeframe, and data feed. You remain responsible for every trading decision.
All inputs are manual. The script does not read or modify a Trading Panel, account, live position, partial exit, position flip or order.
It does not calculate tax or currency conversion. Accuracy depends on fees, spread, slippage, funding and contract point value.
Campaign, Next Fill and Target are arithmetic assumptions. They do not recommend adding capital, averaging, recovery, safe size or expected profit.
AVG, break-even, Cost Gap, Campaign break-even, Next Fill break-even and Qty required all derive from the same manual position and cost assumptions. Do not count them as independent trade reasons or guaranteed execution outcomes.
Clarify weighted AVG, cost models, point value and direction-aware VS BE.
Yes. It is a free, open-source indicator published by SG Group on TradingView. Review TradingView’s terms and the conditions attached to the public script before reuse or redistribution.
Start with the published defaults and observe the drawings and state changes first. Then change one input at a time for the symbol, timeframe and data feed so you can identify what caused each visual change.
Yes, but similar lines, bands, backgrounds and tables can overlap and obscure their source. Isolate each indicator first and hide duplicate components. Visual overlap alone is not stronger evidence or signal agreement.
No. It is analysis and visualization context consistent with the public description. It does not provide entries, exits, targets, stops, price forecasts, or promises of profit, win rate or accuracy.
Fixed costs, carry, other cash adjustments and realized P&L require a valid point value for conversion into price units. Remove inapplicable cash costs or verify the contract point value.
This guide is grounded in SG Group’s live catalogue, the script’s published TradingView description, and the user-facing inputs in its open source. Labels and defaults can change after a script update.