

What it visualizes
Fast/Base/Slow trails, Compact through Detailed tables, optional tint, Base-flip or all-event labels, State, Fingerprint, Transition context, Agreement, Boundary distance and Flip age.
FreeOpen sourcePine Script v6
Calculate Fast, Base and Slow ATR Supertrend profiles and organize direction agreement, ATR distance to the Base boundary, Pressure, recent flips, touches, cascades, trail slope and ATR drift.
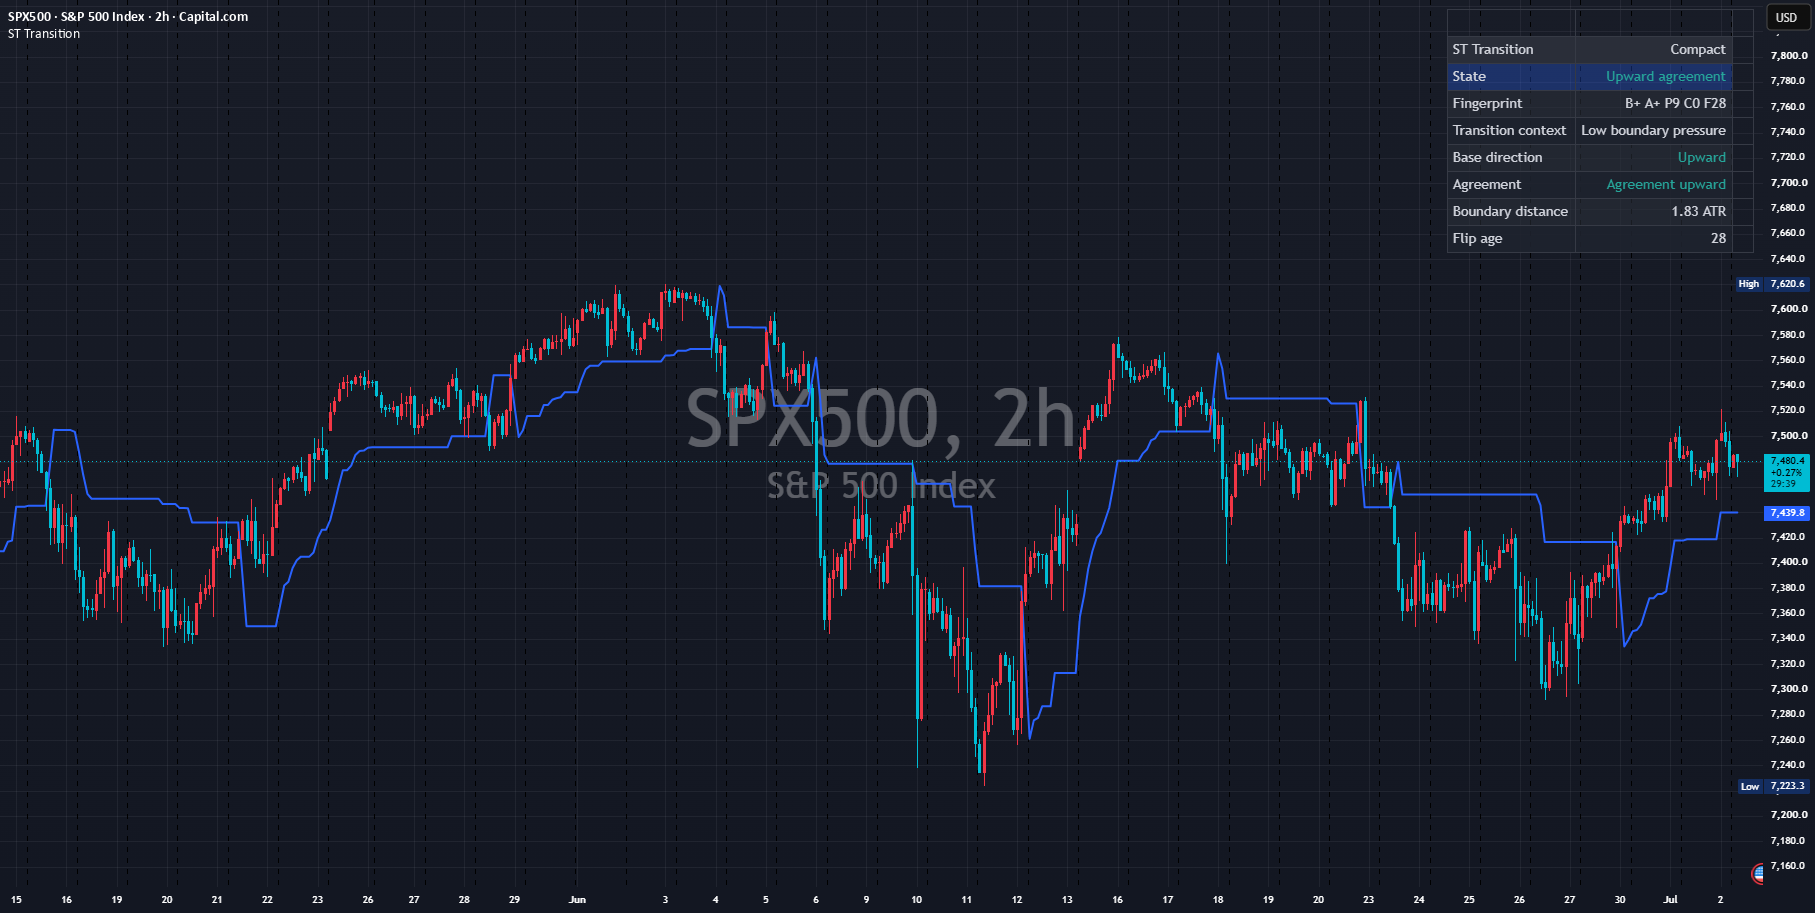
Base is the primary visible trail, with Fast 7×2, Base 10×3 and Slow 21×4 as starting defaults. Agreement requires at least two valid profiles. Base-boundary proximity is mapped to a 0–100 Pressure score.
Fast/Base/Slow trails, Compact through Detailed tables, optional tint, Base-flip or all-event labels, State, Fingerprint, Transition context, Agreement, Boundary distance and Flip age.
Each profile maintains its ATR bands and direction. Agreement Score averages the enabled direction signs. Pressure inversely scales Base trail distance in ATR units and is proximity, not flip probability.
A valid Base and at least one additional valid profile are required; otherwise the table says Need 2+ valid profiles.
Boundary distance is absolute close-to-Base-trail distance divided by Base ATR. Higher Pressure only means nearer.
Flip age, rising-edge boundary touch and same-direction flips inside the cascade window are recorded separately.
Add the public script to a chart and identify every drawing in the default configuration first. Change only one input at a time.
Open the public Supertrend Transition Framework page and add it to a TradingView chart. No SG Group account is required.
Overlapping lines, bands, backgrounds or tables can be duplicate drawings of the same kind of information. Never treat visual overlap by itself as stronger evidence or signal agreement. A standard Supertrend, ATR stop, Keltner channel and all three profiles can duplicate stepped trails and reference lines. Preserve the default Base-only view until every source is identified.
Do not turn one value or color into a conclusion. Check the condition, persistence and relationship to price in order.
Resolve Need profiles, Need base profile and Warming up before reading State.
Direction agreement and proximity are different axes. High Pressure is not a flip forecast.
Flip age, last touch and partial/full cascade describe recent events, not the next direction.
At least two valid profiles agree beyond the threshold; not a forecast.
Valid profile directions do not satisfy an agreement threshold.
Absolute close-to-Base-trail distance in Base ATR units.
Proximity to the Base boundary; high is not flip probability.
Some / all valid profiles flipped into the Base direction inside the lookback.
Slope of the Base trail itself, distinct from price momentum.
The labels below match the published script’s English Inputs panel. Defaults reflect the public source at the time of review and may change in a later TradingView update.
On small screens, each input is reformatted as a readable stacked card.
| Input label | Default / options | What it controls and when to adjust it |
|---|---|---|
Band source | hl2 | Price series used to center the ATR bands. |
Flip source | close | Price series used to confirm Supertrend direction flips. |
Confirm events on bar close | true | Restricts event qualification to confirmed bar closes. |
Use automatic warm-up | true | Automatically waits for the active calculation lengths to warm up. |
| Input label | Default / options | What it controls and when to adjust it |
|---|---|---|
Enable | true | Enables the Fast Supertrend profile. |
ATR length | 7 | min: 1 | ATR length for the Fast profile. |
Multiplier | 2.0 | min: 0.1 | step: 0.1 | ATR multiplier for the Fast profile. |
Show line | false | Shows the Fast trail line. |
Color | #787B86 | Fast trail line color. |
Width | 1 | range: 1–4 | Fast trail line width. |
Transparency | 40 | range: 0–100 | Fast trail transparency. |
| Input label | Default / options | What it controls and when to adjust it |
|---|---|---|
Enable | true | Enables the anchor Base Supertrend profile. |
ATR length | 10 | min: 1 | ATR length for the Base profile. |
Multiplier | 3.0 | min: 0.1 | step: 0.1 | ATR multiplier for the Base profile. |
Show line | true | Shows the Base trail line. |
Color | #2962FF | Base trail line color. |
Width | 2 | range: 1–4 | Base trail line width. |
Transparency | 0 | range: 0–100 | Base trail transparency. |
| Input label | Default / options | What it controls and when to adjust it |
|---|---|---|
Enable | true | Enables the Slow Supertrend profile. |
ATR length | 21 | min: 1 | ATR length for the Slow profile. |
Multiplier | 4.0 | min: 0.1 | step: 0.1 | ATR multiplier for the Slow profile. |
Show line | false | Shows the Slow trail line. |
Color | #B2B5BE | Slow trail line color. |
Width | 1 | range: 1–4 | Slow trail line width. |
Transparency | 40 | range: 0–100 | Slow trail transparency. |
| Input label | Default / options | What it controls and when to adjust it |
|---|---|---|
Agreement threshold | 60 | range: 0–100 | Agreement-score threshold for upward or downward agreement. |
Pressure ATR window | 2.0 | min: 0.1 | step: 0.1 | ATR-distance window mapped to the 0–100 pressure score. |
High pressure threshold | 70 | range: 0–100 | Threshold for High boundary pressure and its event. |
Boundary touch tolerance ATR | 0.15 | min: 0 | step: 0.05 | ATR-distance tolerance for a boundary touch. |
Cascade lookback | 20 | range: 1–200 | Lookback within which aligned flips form a cascade. |
Trail slope lookback | 5 | min: 1 | Bars used to measure Base-trail slope. |
Trail slope flat threshold % | 0.02 | min: 0 | step: 0.01 | Percent-change threshold treated as a flat trail. |
ATR drift lookback | 10 | min: 1 | Bars used to measure Base-ATR drift. |
ATR drift threshold % | 5.0 | min: 0 | step: 0.5 | Percent threshold separating rising, falling, and steady ATR input. |
Minimum state bars for event | 1 | range: 1–20 | Required state persistence before a state event. |
Event cooldown bars | 0 | range: 0–50 | Cooldown between final events. |
| Input label | Default / options | What it controls and when to adjust it |
|---|---|---|
Show context table | true | Shows the context table. |
Table layout | Compact | options: Compact, Standard, Detailed | Selects Compact, Standard, or Detailed table content. |
Table position | Top right padded | options: Top right padded, Top right, Top center, Middle right, Bottom right, Bottom center | Selects table position; padded adds top-right spacing. |
Table text size | Normal | options: Tiny, Small, Normal, Large | Sets table body text size. |
Label mode | Off | options: Off, Base flips, All events | Selects which confirmed event labels appear on the chart. |
Show background tint | false | Shows a state-based background tint. |
One event per bar | true | Limits final output to the highest-priority event per bar. |
Maximum event labels | 50 | range: 10–200 | Maximum event labels retained on the chart. |
Show realtime status | true | Shows confirmed/realtime status in the table. |
Show bar status in compact layout | false | Adds the bar-status row to Compact layout. |
| Input label | Default / options | What it controls and when to adjust it |
|---|---|---|
Header text size | Normal | options: Tiny, Small, Normal, Large | Sets table-header text size. |
Frame width | 1 | range: 0–5 | Table frame width. |
Border width | 1 | range: 0–5 | Table cell-border width. |
Alternating rows | true | Uses alternating row backgrounds. |
State row highlight | true | Highlights the current State row. |
Top right padded spacing | 2 | range: 0–8 | Spacing used by Top right padded placement. |
Fixed cell sizing | false | Uses explicit cell sizing instead of automatic sizing. |
Label/value width | 0 | range: 0–30 | Fixed label/value cell width; zero leaves it automatic. |
Row/header height | 0 | range: 0–10 | Fixed row/header height; zero leaves it automatic. |
| Input label | Default / options | What it controls and when to adjust it |
|---|---|---|
Positive structure color | #26A69A | Positive/upward structure color. |
Negative structure color | #EF5350 | Negative/downward structure color. |
Neutral structure color | #B2B5BE | Mixed or neutral structure color. |
Active trail color | #FFA726 | Active Base-trail highlight color. |
Table background | #1E222D | transparency: 10 | Table background color and transparency. |
Table header background | #2A2E39 | transparency: 0 | Table-header background color and transparency. |
Table text color | #D1D4DC | Table body text color. |
Table alt row background | #2A2E39 | transparency: 40 | Alternate-row background color and transparency. |
Table state highlight | #2962FF | transparency: 70 | State-row highlight color and transparency. |
Table border color | #363A45 | Table border color. |
Table frame color | #363A45 | Table frame color. |
Fill / tint transparency | 90 | range: 0–100 | Fill and background-tint transparency. |
Label transparency | 10 | range: 0–100 | Event-label transparency. |
Label text color | #FFFFFF | Event-label text color. |
Alerts are state, touch or transition events defined in the public source. They are not trade instructions.
This tool is for analysis and visualization. It is not investment advice, a trade recommendation, a forecast, or a promise of profit or accuracy. Results depend on inputs, symbol, timeframe, and data feed. You remain responsible for every trading decision.
ATR boundaries derive from past price. Agreement can persist, unwind or flip.
Higher means closer to the active boundary, not greater risk, flip probability or a recommended stop.
ATR length, Multiplier, Band source and Flip source materially change each boundary.
Base trail, Agreement, Pressure and Cascade are related outputs from the same ATR-boundary family. Do not count them as independent trade signals or turn the line into an order.
Clarify Agreement, Pressure, touches, cascades and non-optimized defaults.
Yes. It is a free, open-source indicator published by SG Group on TradingView. Review TradingView’s terms and the conditions attached to the public script before reuse or redistribution.
Start with the published defaults and observe the drawings and state changes first. Then change one input at a time for the symbol, timeframe and data feed so you can identify what caused each visual change.
Yes, but similar lines, bands, backgrounds and tables can overlap and obscure their source. Isolate each indicator first and hide duplicate components. Visual overlap alone is not stronger evidence or signal agreement.
No. It is analysis and visualization context consistent with the public description. It does not provide entries, exits, targets, stops, price forecasts, or promises of profit, win rate or accuracy.
No. It only maps current proximity to the Base boundary onto 0–100. It is not flip probability, risk size or a recommended stop.
This guide is grounded in SG Group’s live catalogue, the script’s published TradingView description, and the user-facing inputs in its open source. Labels and defaults can change after a script update.