Bollinger Bands Asymmetry Attribution Guide | SG Group
Skip to content
Japanese page

FreeOpen sourcePine Script v6

TradingView Free Indicator

Separate above-basis and below-basis dispersion into observation frequency and conditional squared-excursion severity. Inspect stabilized asymmetric wings alongside their attribution, latest mass shift and side-normalized location.

Asymmetric Bands / Dispersion Attribution
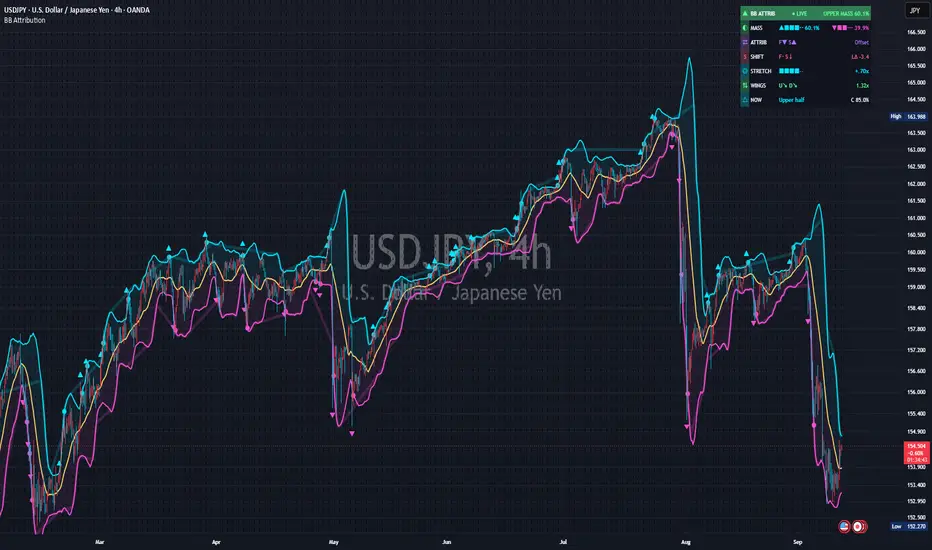
Real chart published on TradingView: Bollinger Bands Asymmetry Attribution
Real chart image from the published TradingView page. The symbol, timeframe, settings and prices shown are a captured example, not current data or a trading result.
PurposeDistinguish directional dispersion from its frequency and severity drivers
Best forUsers studying dispersion, contraction and the sources of upper/lower asymmetry
Primary outputAsymmetric wings, attribution readout and transition markers
Chart placementPrice-chart overlay
01 — Overview

Read wing geometry and dispersion drivers separately

Conventional Bollinger Bands place one standard deviation symmetrically around an average. The primary wings here use independently stabilized side statistics. The measurements share one basis-relative framework rather than combining unrelated oscillators or volume filters.

What it visualizes

A basis, asymmetric upper/lower wings, split fill, dominant-wing glow, seven-row readout and sparse excursion/re-entry/cross-wing markers. A conventional SMA-centered symmetric reference is available separately and is off by default.

How it works

For each window, deviations equal historical observations minus the current selected basis. Positive and negative squared deviations accumulate separately. Each side’s semivariance equals its squared mass divided by all valid observations: occupancy × conditional squared-excursion severity.

Stabilization changes geometry only

Sparse sides are partly shrunk toward pooled dispersion. Square roots, the multiplier and optional RMA smoothing produce distances from the basis. Unshrunk mass, occupancy and severity statistics remain separate.

Level and change answer different questions

ATTRIB explains current asymmetry; SHIFT explains its one-bar change. Upper mass can remain dominant while the latest change moves toward the lower side.

Order-neutral change attribution

Delta semivariance = delta occupancy × average severity + delta severity × average occupancy. The midpoint split allocates interaction equally. Upper-minus-lower change is normalized by average total semivariance across the two windows, not by price.

Raw identities versus smoothed diagnostics

MASS, frequency and severity are smoothed independently. Their visible values need not preserve the raw algebraic identity. The Data Window residual checks numerical consistency of the raw shift decomposition.

02 — Install and start

Add it to TradingView

Use a standard time-based chart. Identify both wings, the basis and readout at default settings. Verify Source and Basis type before changing one input at a time.

Bollinger Bands Asymmetry Attribution

Open the public Bollinger Bands Asymmetry Attribution page and add it to TradingView. No SG Group account is required.

  1. Open the “Use on TradingView” link below.
  2. Select “Use on chart” on TradingView to add the script to your chart.
  3. Open the gear icon, then Settings → Inputs, and observe the default configuration first.
  4. Change one input at a time for the symbol and timeframe you are studying.
Observe the defaults firstChange one input at a timeVerify symbol, timeframe and feed

Prevent misreads when indicators overlap

Overlapping lines, bands, backgrounds or tables can be duplicate drawings of the same kind of information. Never treat visual overlap by itself as stronger evidence or signal agreement. Conventional Bollinger Bands, Keltner channels and VWAP deviation envelopes can duplicate nearby lines and fills. The optional classic reference is also a different calculation. Identify which geometry a marker crossed.

  • Hide other envelopes to isolate cyan upper, magenta lower and the basis.
  • Enable the classic reference only when needed for comparison.
  • Use only necessary fills, glow and rail; move overlapping readouts.
  • Triangles mark first excursions, circles re-entry and a single diamond a cross-wing jump. Do not count a consolidated jump as independent signals.
03 — How to read it

A practical reading order

Read MASS, ATTRIB, SHIFT, STRETCH, WINGS and NOW in order to separate level, driver, change, location, geometry motion and realized containment.

Mass and its drivers

Cyan and magenta MASS shares sum to 100%. F is occupancy; S is conditional squared-excursion severity. ▲ favors upper, ▼ lower, · is below threshold, and S? indicates inadequate comparison samples.

One-bar change

SHIFT F↑/S↑ moves the directional mass difference upward; F↓/S↓ moves it downward. These arrows do not prescribe trade direction.

Side-normalized location

STRETCH divides source-to-basis distance by the same-side wing distance. +1.00x and −1.00x are the upper and lower wings; ±0.50x is halfway. Absolute stretch above one is outside. Default edge starts at 0.8.

Wing motion and past containment

WINGS U/D shows upper/lower distance expanding, contracting or stable. The ratio is upper distance divided by lower distance. NOW reports current location or a live transition preview; C is past realized containment.

Status and display terms

LIVE / CLOSE

Execution status on a forming/closed bar. Confirmation does not freeze the live readout.

Balanced / Frequency / Severity

Neither driver is material / frequency-only bias / severity-only bias.

Reinforced / Offset

Frequency and severity reinforce / oppose each other. These describe composition.

Sparse / S?

Too few observations on a side for severity comparison.

No dispersion / Warming

No meaningful basis-relative dispersion / required history unavailable.

SHIFT: Frequency / Severity

Frequency/severity is the dominant change driver; upper/lower describes the mass-difference direction.

SHIFT: Reinforced / Shared / Offset / Stable

Same-direction reinforcement / shared net direction without dominant driver / opposing components / net shift below threshold.

NOW: Upper outside / edge / half

Upper outside / near upper edge / upper half. Lower states mirror these; On basis is at the center.

C / U:D

Realized containment / upper-to-lower distance ratio; neither is a forecast probability.

04 — Settings reference

Settings reference

The labels below match the published script’s English Inputs panel. Defaults reflect the public source at the time of review and may change in a later TradingView update.

On small screens, each input is reformatted as a readable stacked card.

1. Core Bands

7 inputs
Input labelDefault / optionsWhat it controls and when to adjust it
Sourceclose / options: open, high, low, close, hl2, hlc3, hlcc4, ohlc4Selects the series analyzed throughout the study. The default is close. hl2 averages high/low; hlc3 averages high/low/close; hlcc4 weights close twice; ohlc4 averages OHLC.
Attribution length20 / min 5, max 250Sets the rolling window, default 20 observations. Each window compares historical values with its current basis, not each bar’s former basis.
Basis typeSMA / options: SMA, EMA, RMA, WMASMA provides the arithmetic-center interpretation. EMA, RMA and WMA are alternative basis-relative research choices.
Wing multiplier2 / min 0.1, max 10Scales the independently stabilized root-mean-square excursions. The default 2 is not a confidence level or a future coverage probability.
Sparse-side stabilization4 / min 0, max 50Stabilizes a sparsely populated wing toward pooled dispersion. Zero disables shrinkage when that side has observations. Raw attribution statistics are unchanged.
Wing smoothing2 / min 1, max 20RMA smoothing of wing distances; 1 leaves stabilized widths unsmoothed. Smoothing adds lag.
Show classic symmetric referenceOffShows a conventional SMA-centered symmetric reference. It is off by default and uses a different construction from the primary wings.

2. Asymmetry Attribution

7 inputs
Input labelDefault / optionsWhat it controls and when to adjust it
Attribution smoothing3 / min 1, max 30Smooths mass, frequency and severity diagnostics independently. The visible smoothed diagnostics do not form the exact raw factorization.
Dominance entry threshold12 / min 1, max 90Absolute smoothed mass-bias threshold for entering dominance, default 12. It is not an upper-share level of 12%.
Dominance release threshold7 / min 0, max 89Release hysteresis retains an established dominance state through small counter-moves. Keep it below the entry threshold.
Driver significance threshold6 / min 0, max 80Absolute bias threshold used to classify frequency and severity drivers. It is a display/classification threshold, not a statistical p-value.
Minimum observations per side3 / min 1, max 25Minimum observations on both sides before severity comparison. The effective requirement is capped at half the attribution window. Insufficient samples produce Sparse/S?.
Containment lookback100 / min 10, max 1000Lookback for realized containment, default 100. It measures past observations inside displayed wings and does not guarantee future coverage.
Edge zone starts at0.8 / min 0.5, max 0.99Defines the edge zone in side-normalized units. Default 0.8 starts at 80% of the matching wing distance; 1.00 is the wing.

3. Mass Shift Attribution

3 inputs
Input labelDefault / optionsWhat it controls and when to adjust it
Mass shift smoothing2 / min 1, max 20RMA smoothing for frequency/severity contributions to one-bar directional mass change, separate from level attribution smoothing.
Mass shift significance threshold2 / min 0.1, max 50Threshold for materially active normalized shift components. Default 2 is not a 2% price change.
Mass shift driver dominance ratio1.25 / min 1, max 5Required component-size ratio for one shift driver to dominate, default 1.25.

4. Live Behavior

2 inputs
Input labelDefault / optionsWhat it controls and when to adjust it
Confirmed events onlyOnWhen on, event markers and alerts wait for bar close. Wings and readout remain live. Turning it off permits provisional intrabar events.
Wing motion threshold %0.5 / min 0, max 20Minimum one-bar change in wing distance for expansion/contraction arrows, default 0.5%. It does not describe price direction.

5. Visual Design

20 inputs
Input labelDefault / optionsWhat it controls and when to adjust it
Show asymmetric wingsOnShows the asymmetric upper and lower wing lines.
Show basisOnShows the selected moving basis.
Show split upper/lower fillOnFills the upper and lower regions independently.
Show state railOffShows a state-colored rail behind the basis; off by default.
Show dominant-wing glowOnAdds a translucent glow to the wing matching the current mass-dominance state.
Wing line width2 / min 1, max 5Width of the upper and lower wing lines.
Basis line width2 / min 1, max 5Width of the basis line.
State rail width4 / min 2, max 10Width of the optional state rail.
Dominant glow width5 / min 2, max 12Width of the dominant-wing glow.
Split fill transparency94 / min 0, max 100Split-fill transparency; higher values are more transparent.
State rail transparency86 / min 0, max 100State-rail transparency; higher values are more transparent.
Dominant glow transparency82 / min 0, max 100Dominant-glow transparency; higher values are more transparent.
Upper wingrgba(0,229,255,1)Upper-wing color, cyan by default.
Lower wingrgba(255,77,214,1)Lower-wing color, magenta by default.
Basisrgba(255,209,102,1)Basis color.
Upper-mass statergba(88,255,148,1)Upper-mass state color.
Balanced statergba(178,120,255,1)Balanced-state color.
Lower-mass statergba(255,96,121,1)Lower-mass state color.
Sparse-sample statergba(255,196,74,1)Sparse-sample state color.
Classic referencergba(153,165,190,1)Classic symmetric reference color.

6. Visual Readout

7 inputs
Input labelDefault / optionsWhat it controls and when to adjust it
Readout modeVisual / options: Off, VisualVisual shows the readout; Off hides it.
Readout positionTop right / options: Top right, Middle right, Bottom right, Top left, Middle left, Bottom leftPositions the readout in one of six left/right locations. Separate it from other panels.
Readout text sizeSmall / options: Tiny, Small, NormalChooses Tiny, Small or Normal readout text.
Axis label clearance %3 / min 0, max 12Transparent clearance between edge-anchored readout and price-scale labels, default 3%.
Readout backgroundrgba(15,18,29,1)Readout background color.
Readout transparency8 / min 0, max 100Readout background transparency. Higher values expose more chart content behind the text.
Readout textrgba(244,247,255,1)Readout text color.

7. Markers and Alerts

4 inputs
Input labelDefault / optionsWhat it controls and when to adjust it
Show first outside excursionOnMarks the first inside-to-outside transition with a triangle, not every outside bar.
Show first re-entryOnMarks the first return inside with a circle on the wing.
Show direct cross-wing jumpOnShows one basis diamond for a direct jump between opposite outsides, consolidating duplicate excursion/re-entry markers.
Show dominance-flip markersOffOptional basis markers for transitions into upper/lower mass dominance; off by default.
05 — Alerts

Eight transition alert conditions

Create the desired condition in TradingView. Confirmed events only is on by default: markers and alerts wait for close while wings and the readout continue updating.

  • Upper asymmetric excursion started.
  • Lower asymmetric excursion started.
  • Upper asymmetric re-entry.
  • Lower asymmetric re-entry.
  • Direct cross-wing jump to upper side.
  • Direct cross-wing jump to lower side.
  • Upper semivariance mass dominance started.
  • Lower semivariance mass dominance started.
06 — Limitations and responsible use

Not a buy/sell signal

This tool is for analysis and visualization. It is not investment advice, a trade recommendation, a forecast, or a promise of profit or accuracy. Results depend on inputs, symbol, timeframe, and data feed. You remain responsible for every trading decision.

Not confidence intervals

Primary wings are not conventional Bollinger Bands or confidence intervals. A multiplier of two does not imply 95% coverage. Realized containment is backward-looking. Outside observations alone do not establish reversal, continuation or exhaustion.

Current-basis comparison

Every historical observation in a window is compared with that window’s current basis. EMA/RMA/WMA variants are not conventional semivariance around an arithmetic sample mean.

Sparse is not neutral

Insufficient observations on either side produce Sparse/S?. Stabilized smooth geometry does not make the underlying severity comparison adequately sampled.

Live values remain provisional

The study uses no higher-timeframe requests or lookahead, but forming-bar wings and diagnostics change. Disabling confirmation permits provisional markers and alerts. Synthetic charts change the analyzed series.

Inspect numerical outputs

The Data Window includes bias components, shares, stretch, wing distances, containment, sample adequacy, mass shift and Flow Bridge Identity Residual. Small nonzero residuals can arise from floating-point arithmetic.

Important

MASS, ATTRIB, SHIFT, wings and glow share related statistics. Their agreement is not independent confirmation, a win rate, expected return or future directional probability.

07 — FAQ

Frequently asked questions

Clarify symmetric versus asymmetric geometry, level versus shift, sparse samples and realized coverage.

Are the main wings conventional Bollinger Bands?

No. They use stabilized side-specific conditional excursions. A separate conventional SMA-centered symmetric reference is optional.

Does 60% upper mass mean a 60% chance of rising?

No. It is a smoothed share of basis-relative squared dispersion.

Does smooth geometry imply adequate samples?

No. Sparse-side stabilization changes the drawing, not the raw sample size. Check Sparse and S?.

Can MASS and SHIFT point in different directions?

Yes. MASS is the current level; SHIFT is its latest change. Upper dominance can coexist with a lower-directed change.

Is it free?

It is a free open-source TradingView publication. Review its terms before modification or redistribution.

Source basis and update policy

This guide is grounded in SG Group’s live catalogue, the script’s published TradingView description, and the user-facing inputs in its open source. Labels and defaults can change after a script update.