Fibonacci Retracement Depth & Retest Grid Guide | SG Group
Skip to content
Japanese page

FreeOpen sourcePine Script v6

TradingView Free Indicator

Build editable Fibonacci retracement levels from a confirmed swing, a user-selected manual origin, or a rolling high-low range. Examine current depth, re-armed touch episodes, fixed-horizon responses and proximity to ratios from a larger range on the same chart.

Fibonacci / Retracement Research
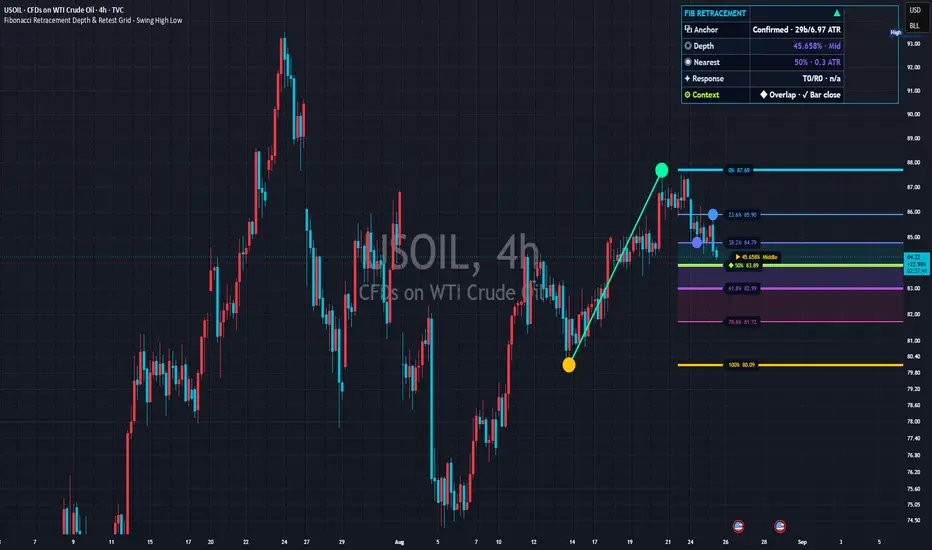
Real chart published on TradingView: Fibonacci Retracement Depth & Retest Grid - Swing High Low
Real chart image from the published TradingView page. The symbol, timeframe, settings and prices shown are a captured example, not current data or a trading result.
PurposeDescribe retracement depth and observed ratio interaction
Best forUsers researching pullback depth, distinct level contacts and fixed-horizon responses
Primary outputOrigin/terminal, ten ratio slots, three bands, touch/response context and readout
Chart placementPrice-chart overlay
01 — Overview

Separate the measured leg from the time it became available

Every level is terminal + (origin − terminal) × ratio. The terminal is 0% and the origin is 100%. Current depth uses the same orientation for upward and downward legs; below 0% is beyond the terminal and above 100% is beyond the origin. This is descriptive research, not a signal, forecast, probability model or AI system.

What it visualizes

A directional origin-to-terminal leg, H/L markers, ten editable ratio lines, ratio/price labels, optional 38.2–50.0%, 50.0–61.8% and 61.8–78.6% bands, current-depth cursor, latest-touch markers, larger-range proximity diamonds and a compact readout.

How it works

Automatic swing accepts alternating right-confirmed highs and lows after spacing, ATR-size and same-side revision filters. Manual origin searches from a selected time/price point. Rolling range chronologically joins the extremes inside a fixed window. A changed origin or terminal resets all current-structure touch and response statistics.

Keep the three anchor engines distinct

Automatic swing uses right-confirmed pivots and a finalized local fallback during warm-up. Manual origin retains the selected point and never silently substitutes an automatic structure. Rolling range can change as its fixed window advances.

Pivot location is not availability time

H/L sits on the historical pivot bar, but the pair is unavailable until Right bars have elapsed. Horizontal levels begin at availability instead of extending backward through bars where the complete pair was not knowable.

Touch, response and proximity answer different questions

A touch must leave a wider re-arm envelope before another episode is counted. Response is normalized displacement at a fixed later bar. A larger-range diamond is only a distance match, not level strength or reversal probability.

02 — Install and start

Add it to TradingView

Add the public script to a standard-candlestick price chart. Under the defaults, identify the origin, terminal, diagonal leg, 0%–100% levels, three depth bands, current-depth cursor and readout before changing one input at a time.

Fibonacci Retracement Depth & Retest Grid – Swing High Low

Open the public Fibonacci Retracement Depth & Retest Grid – Swing High Low page and add it to a TradingView chart. Automatic swing uses confirmed pivots and a finalized local-range fallback until a complete pair exists. No SG Group account is required.

  1. Open the “Use on TradingView” link below.
  2. Select “Use on chart” on TradingView to add the script to your chart.
  3. Open the gear icon, then Settings → Inputs, and observe the default configuration first.
  4. Change one input at a time for the symbol and timeframe you are studying.
Observe the defaults firstChange one input at a timeVerify symbol, timeframe and feed

Prevent misreads when indicators overlap

Overlapping lines, bands, backgrounds or tables can be duplicate drawings of the same kind of information. Never treat visual overlap by itself as stronger evidence or signal agreement. TradingView Fib Retracement, another automatic Fibonacci, pivots, swing markers, support/resistance, horizontal levels and risk/reward drawings can duplicate the 0%–100% grid, three bands, anchors, touch markers, diamonds, right-side labels and readout. Ratio 4/5 width and fills style the same levels; they are not separate evidence.

  • Hide TradingView Fib Retracement, every other automatic Fibonacci, pivots and horizontal levels while identifying this study’s diagonal leg and 0%/100% anchors.
  • Toggle depth bands, latest-touch markers and larger-range overlap separately to identify fills, circles and diamonds.
  • Toggle each Ratio 1–10 Show control. Hide duplicate custom values or a line supplied by another tool.
  • Move the readout away from other fixed panels and use edge clearance to preserve TradingView High/Low and price-scale labels. Never count coincident lines as stronger evidence.
03 — How to read it

A practical reading order

Do not begin by treating a ratio as support, resistance or a reversal forecast. Verify the anchor engine, availability time, current depth, touch re-arm rule and fixed-horizon response definition in order.

Verify engine, direction and availability

Read Anchor as Confirmed, Manual, Range, Past swing or Past range, then distinguish H/L location from the horizontal-level start. Automatic swing necessarily includes Right bars of delay.

Read depth and the nearest ratio

Depth runs from terminal 0% toward origin 100%. Nearest identifies the closest enabled ratio and ATR-normalized distance. Shallow, Mid, Deep, T+ and O+ classify location only.

Do not count T, R and diamonds as independent signals

T counts distinct touch episodes and R counts completed fixed-horizon measurements. Average response and larger-range proximity derive from the same price and ratio structure and do not become multiple confirmations.

Status and display terms

Confirmed / Manual / Range

Confirmed-swing, user-selected manual-origin, or fixed-window high-low anchoring.

Past swing / Past range / Study

Retrospective visible-right-edge confirmed swing / local-range fallback / study state with sequential response and price alerts disabled.

Depth / Nearest

Current proportional retracement / nearest enabled ratio and ATR-normalized distance; not a trade rating.

Shallow / Mid / Deep / T+ / O+

Shallow, middle, deep, beyond-terminal or beyond-origin location; not reversal probability.

T / R

Distinct touch episodes / completed fixed-horizon response measurements for the active structure.

◇ Overlap

A primary ratio is within tolerance of an enabled ratio from the larger rolling range; not strength or support/resistance.

H / L

The historical high/low pivot location; availability occurs only after Right bars have elapsed.

04 — Settings reference

Settings reference

The labels below match the published script’s English Inputs panel. Defaults reflect the public source at the time of review and may change in a later TradingView update.

On small screens, each input is reformatted as a readable stacked card.

1. Anchor Engine

18 inputs
Input labelDefault / optionsWhat it controls and when to adjust it
Use visible right edge in past chartsOnWhen the latest bar is outside the visible chart, the visible right edge becomes the study endpoint. Automatic swing mode recalculates from a bounded local historical window; Manual origin preserves the selected point and searches only up to that visible endpoint.
Anchor engineAutomatic swing / options: Automatic swing, Manual origin, Rolling rangeAutomatic swing is the default. It uses the latest accepted right-confirmed pivot leg and a bounded local-range fallback during warm-up, so the grid remains visible. Manual origin lets you select the structural start point and calculates the opposite terminal automatically. Rolling range uses a fixed lookback.
Origin pointInteractive pointControls origin point. Start with the published default and change one input at a time.
Origin point (paired time field; no separate UI label)Interactive pointUsed only in Manual origin mode. After switching modes, use Reset points from the script menu to place the paired point, then drag it when needed. Every point change recalculates the origin, direction, terminal, levels, depth, and statistics from scratch.
Origin directionAuto from point / options: Auto from point, Up leg, Down legAuto first interprets a point nearer the selected bar's low as an up-leg origin and a point nearer its high as a down-leg origin. If that preferred side has no valid later terminal but the opposite side does, Auto uses the valid side instead. Up leg and Down leg enforce the selected direction without fallback.
Origin price handlingSnap to selected bar / options: Snap to selected bar, Use selected priceSnap uses the selected bar's low for an up leg or high for a down leg; when Swing source is Closes, it uses the selected bar's close. Use selected price preserves the exact price coordinate of the point.
Use closed bars for auto terminalOnRecommended for live use. The automatic terminal updates from closed bars only, reducing intrabar anchor flicker. Current depth can still update with the live price.
Terminal search limit bars0 / min 0, max 5000Maximum bars searched after the selected origin. Zero searches through the live edge or the visible historical endpoint. If the limit leaves no valid terminal, no Fibonacci structure is displayed.
Swing sourceWicks / options: Wicks, ClosesWicks uses high and low. Closes uses close for both upper and lower pivot/range detection.
Pivot left bars5 / min 1, max 50Sets the observation length for pivot left bars.
Right bars5 / min 1, max 50A swing pivot becomes available only after this many bars have closed to its right.
Minimum bars between alternating pivots3 / min 1, max 200Sets the observation length for minimum bars between alternating pivots.
Minimum range span bars5 / min 1, max 500Used only when Anchor engine is Rolling range.
ATR length14 / min 1, max 500Sets the observation length for atr length.
Minimum leg ATR1 / min 0, max 100, step 0.1Filters newly alternating pivots whose price distance is smaller than this ATR multiple. A value of 0 disables the size filter.
Same-side revision ticks1 / min 0, max 1000, step 0.25A same-side pivot updates the active terminal only if it exceeds the previous terminal by at least this many minimum ticks. This reduces flicker from tiny revisions in live conditions.
Rolling range lookback200 / min 10, max 3000Used only when Anchor engine is Rolling range.
Automatic local window bars120 / min 20, max 500Controls the bounded local range used while Automatic swing is warming up and when studying a past chart. A larger value expands structural context; a smaller value keeps the calculation more local. Manual origin ignores this window.

2. Fibonacci Levels

20 inputs
Input labelDefault / optionsWhat it controls and when to adjust it
ShowOnShows or hides Ratio 1 without changing the stored ratio value.
Ratio 10 / min -2, max 3, step 0.001Sets the editable value for Ratio 1; values outside 0–1 are extensions.
ShowOnShows or hides Ratio 2 without changing the stored ratio value.
Ratio 20.236 / min -2, max 3, step 0.001Sets the editable value for Ratio 2; values outside 0–1 are extensions.
ShowOnShows or hides Ratio 3 without changing the stored ratio value.
Ratio 30.382 / min -2, max 3, step 0.001Sets the editable value for Ratio 3; values outside 0–1 are extensions.
ShowOnShows or hides Ratio 4 without changing the stored ratio value.
Ratio 40.5 / min -2, max 3, step 0.001Sets the editable value for Ratio 4; values outside 0–1 are extensions.
ShowOnShows or hides Ratio 5 without changing the stored ratio value.
Ratio 50.618 / min -2, max 3, step 0.001Sets the editable value for Ratio 5; values outside 0–1 are extensions.
ShowOffShows or hides Ratio 6 without changing the stored ratio value.
Ratio 60.65 / min -2, max 3, step 0.001Sets the editable value for Ratio 6; values outside 0–1 are extensions.
ShowOffShows or hides Ratio 7 without changing the stored ratio value.
Ratio 70.705 / min -2, max 3, step 0.001Sets the editable value for Ratio 7; values outside 0–1 are extensions.
ShowOnShows or hides Ratio 8 without changing the stored ratio value.
Ratio 80.786 / min -2, max 3, step 0.001Sets the editable value for Ratio 8; values outside 0–1 are extensions.
ShowOffShows or hides Ratio 9 without changing the stored ratio value.
Ratio 90.886 / min -2, max 3, step 0.001Sets the editable value for Ratio 9; values outside 0–1 are extensions.
ShowOnShows or hides Ratio 10 without changing the stored ratio value.
Ratio 101 / min -2, max 3, step 0.001Sets the editable value for Ratio 10; values outside 0–1 are extensions.

3. Reaction Research

9 inputs
Input labelDefault / optionsWhat it controls and when to adjust it
Track level-touch episodesOnCounts a new touch only after price has first moved outside the re-arm distance. Statistics reset whenever the active anchors change.
Touch tolerance modeATR / options: ATR, Leg percent, TicksControls touch tolerance mode. Start with the published default and change one input at a time.
ATR tolerance0.08 / min 0, max 10, step 0.01Controls atr tolerance. Start with the published default and change one input at a time.
Leg %0.2 / min 0, max 20, step 0.05Controls leg %. Start with the published default and change one input at a time.
Ticks4 / min 1, max 10000Controls ticks. Start with the published default and change one input at a time.
Re-arm distance multiplier1.75 / min 1, max 20, step 0.25After a touch, price must move completely outside tolerance multiplied by this value before another touch can be counted.
Response measurement bars5 / min 1, max 100Measures price a fixed number of chart bars after each new touch. With confirmed-only events enabled, the measurement uses the closing value of the horizon bar. Positive values mean movement back toward the terminal anchor; negative values mean movement toward or beyond the origin anchor. This is descriptive, not predictive.
Evaluate events on confirmed bars onlyOnShows, hides or enables evaluate events on confirmed bars only.
Show latest touch marker per levelOnShows, hides or enables show latest touch marker per level.

4. Larger-Range Overlap

6 inputs
Input labelDefault / optionsWhat it controls and when to adjust it
Highlight larger-range ratio overlapOnCompares each active Fibonacci level with the same enabled ratios calculated from a longer rolling high/low range. A diamond identifies proximity within the selected tolerance; it does not imply that a level will hold.
Larger-range lookback500 / min 20, max 3000Sets the observation length for larger-range lookback.
Overlap tolerance modeATR / options: ATR, Primary leg percent, TicksControls overlap tolerance mode. Start with the published default and change one input at a time.
ATR tolerance0.12 / min 0, max 10, step 0.01Controls atr tolerance. Start with the published default and change one input at a time.
Leg %0.3 / min 0, max 20, step 0.05Controls leg %. Start with the published default and change one input at a time.
Ticks6 / min 1, max 10000Controls ticks. Start with the published default and change one input at a time.

5. Visual Design

23 inputs
Input labelDefault / optionsWhat it controls and when to adjust it
Show anchor legOnShows, hides or enables show anchor leg.
Show origin and terminal markersOnShows, hides or enables show origin and terminal markers.
Show level labelsOnShows, hides or enables show level labels.
Show depth bandsOnUses the Ratio 3, 4, 5, and 8 input slots to form three configurable retracement-depth bands.
Extend levels rightOnShows, hides or enables extend levels right.
Level line styleSolid / options: Solid, Dashed, DottedControls level line style. Start with the published default and change one input at a time.
Regular line width2 / min 1, max 4Controls regular line width. Start with the published default and change one input at a time.
Ratio 4 / 5 width4 / min 1, max 5Controls ratio 4 / 5 width. Start with the published default and change one input at a time.
Level label contentRatio + price / options: Ratio, Price, Ratio + price, Research detailControls level label content. Start with the published default and change one input at a time.
Label offset bars2 / min 0, max 50Sets the observation length for label offset bars.
Label sizeSmall / options: Tiny, Small, NormalControls label size. Start with the published default and change one input at a time.
Base line transparency0 / min 0, max 80Sets the transparency for base line transparency; higher values are less prominent.
Shallow band transparency90 / min 70, max 100Sets the transparency for shallow band transparency; higher values are less prominent.
Core82 / min 70, max 100Sets the transparency for core; higher values are less prominent.
Deep90 / min 70, max 100Sets the transparency for deep; higher values are less prominent.
Shallow colorrgba(0,214,255,1)Sets the display color for shallow color.
Middlergba(146,92,255,1)Sets the display color for middle.
Deeprgba(255,56,118,1)Sets the display color for deep.
Originrgba(255,196,0,1)Sets the display color for origin.
Up legrgba(0,255,163,1)Sets the display color for up leg.
Down legrgba(255,86,86,1)Sets the display color for down leg.
Overlaprgba(173,255,47,1)Sets the display color for overlap.
Depth cursorrgba(255,214,0,1)Sets the display color for depth cursor.

6. Readout and Alerts

6 inputs
Input labelDefault / optionsWhat it controls and when to adjust it
Show context readoutOnShows, hides or enables show context readout.
Readout positionTop right / options: Top right, Bottom right, Top left, Bottom leftControls readout position. Start with the published default and change one input at a time.
Readout edge clearance (%)6 / min 2, max 20Reserves transparent horizontal space between the readout and the chart edge. This prevents the fixed panel from covering TradingView High/Low labels and price-scale markers. Increase only when a narrow device or large chart labels need more room.
Readout text sizeNormal / options: Tiny, Small, NormalControls readout text size. Start with the published default and change one input at a time.
Show current-depth cursorOnShows, hides or enables show current-depth cursor.
Enable dynamic touch alert() callsOffWhen enabled, an alert created with 'Any alert() function call' receives the touched-ratio list and the current close. Confirmed-bar evaluation remains controlled by the event setting above.
05 — Alerts

Factual confirmed-structure, level-contact and boundary-cross alerts

Alerts report a newly confirmed structure, terminal revision, ratio contact, core-band entry or origin/terminal cross. They do not direct a trade or forecast reversal, continuation, target or stop.

  • New confirmed Fibonacci swing structure reports a newly accepted opposite-side pivot pair.
  • Confirmed Fibonacci terminal revision reports a more extreme same-side confirmed pivot that exceeds the configured tick threshold.
  • Level touch, core-band entry, origin cross and terminal cross are price observations under the selected confirmed-bar and ratio settings. Enable dynamic touch calls separately and create an Any alert() function call alert when needed.
06 — Limitations and responsible use

Not a buy/sell signal

This tool is for analysis and visualization. It is not investment advice, a trade recommendation, a forecast, or a promise of profit or accuracy. Results depend on inputs, symbol, timeframe, and data feed. You remain responsible for every trading decision.

Confirmed pivots require delay and can revise

A pivot is unavailable until its right-side bars close. A later more-extreme same-side confirmed pivot can revise the terminal, changing the active structure and resetting statistics. A blanket non-repainting claim would be inaccurate.

Past-chart auto-follow is retrospective

A historical visible-right-edge study already knows the completed local period. Sequential response statistics and price-event alerts are disabled and the readout changes to Study. Use TradingView Bar Replay for chronology-sensitive work.

Finalized OHLC does not reveal intrabar order

One bar can contact several levels without revealing their order. Disabling confirmed-bar evaluation allows realtime states to change before close and reloaded history contains only finalized OHLC.

Results depend on chart data and chart type

The formula is arithmetic in price; logarithmic scale changes visual spacing only. Heikin Ashi, Renko, Kagi and other non-standard charts may contain synthetic prices. Results depend on the symbol, timeframe, session, provider and history supplied by TradingView.

Important

Ratio lines, depth bands, current depth, touch counts, fixed-horizon average response and larger-range proximity are related descriptions from the same anchors and price data. Do not count coincidence as independent evidence or convert it into support, resistance, reversal, continuation, entry, target, stop or probability.

07 — FAQ

Frequently asked questions

Clarify confirmation delay, past-chart study, touch episodes, fixed-horizon response, larger-range proximity and custom ratios.

Is Fibonacci Retracement Depth & Retest Grid – Swing High Low free to use?

Yes. It is a free, open-source indicator published by SG Group on TradingView. Review TradingView’s terms and the conditions attached to the public script before reuse or redistribution.

Should I change the settings immediately?

Start with the published defaults and observe the drawings and state changes first. Then change one input at a time for the symbol, timeframe and data feed so you can identify what caused each visual change.

Can I display it with other indicators?

Yes, but similar lines, bands, backgrounds and tables can overlap and obscure their source. Isolate each indicator first and hide duplicate components. Visual overlap alone is not stronger evidence or signal agreement.

Does the display provide trade signals?

No. It is analysis and visualization context consistent with the public description. It does not provide entries, exits, targets, stops, price forecasts, or promises of profit, win rate or accuracy.

If H or L is drawn on a past bar, were the Fibonacci levels known on that bar?

No. H/L marks where the high or low occurred. Automatic swing becomes available only after Right bars have closed. Horizontal levels begin at availability and are not extended backward through bars where the pair was not yet knowable.

Source basis and update policy

This guide is grounded in SG Group’s live catalogue, the script’s published TradingView description, and the user-facing inputs in its open source. Labels and defaults can change after a script update.