Risk Reward Scenario Analyzer Guide & Settings | SG Group
Skip to content
Japanese page

FreeOpen sourcePine Script v6

TradingView Free Indicator

Visualize manually defined Entry, Stop and Target as risk and reward boxes. Calculate planned R and mathematical break-even win rate, stress-test R against favorable and adverse entry drift, then inspect which level was reached first using confirmed chart-bar OHLC.

Risk Management / Scenario Research
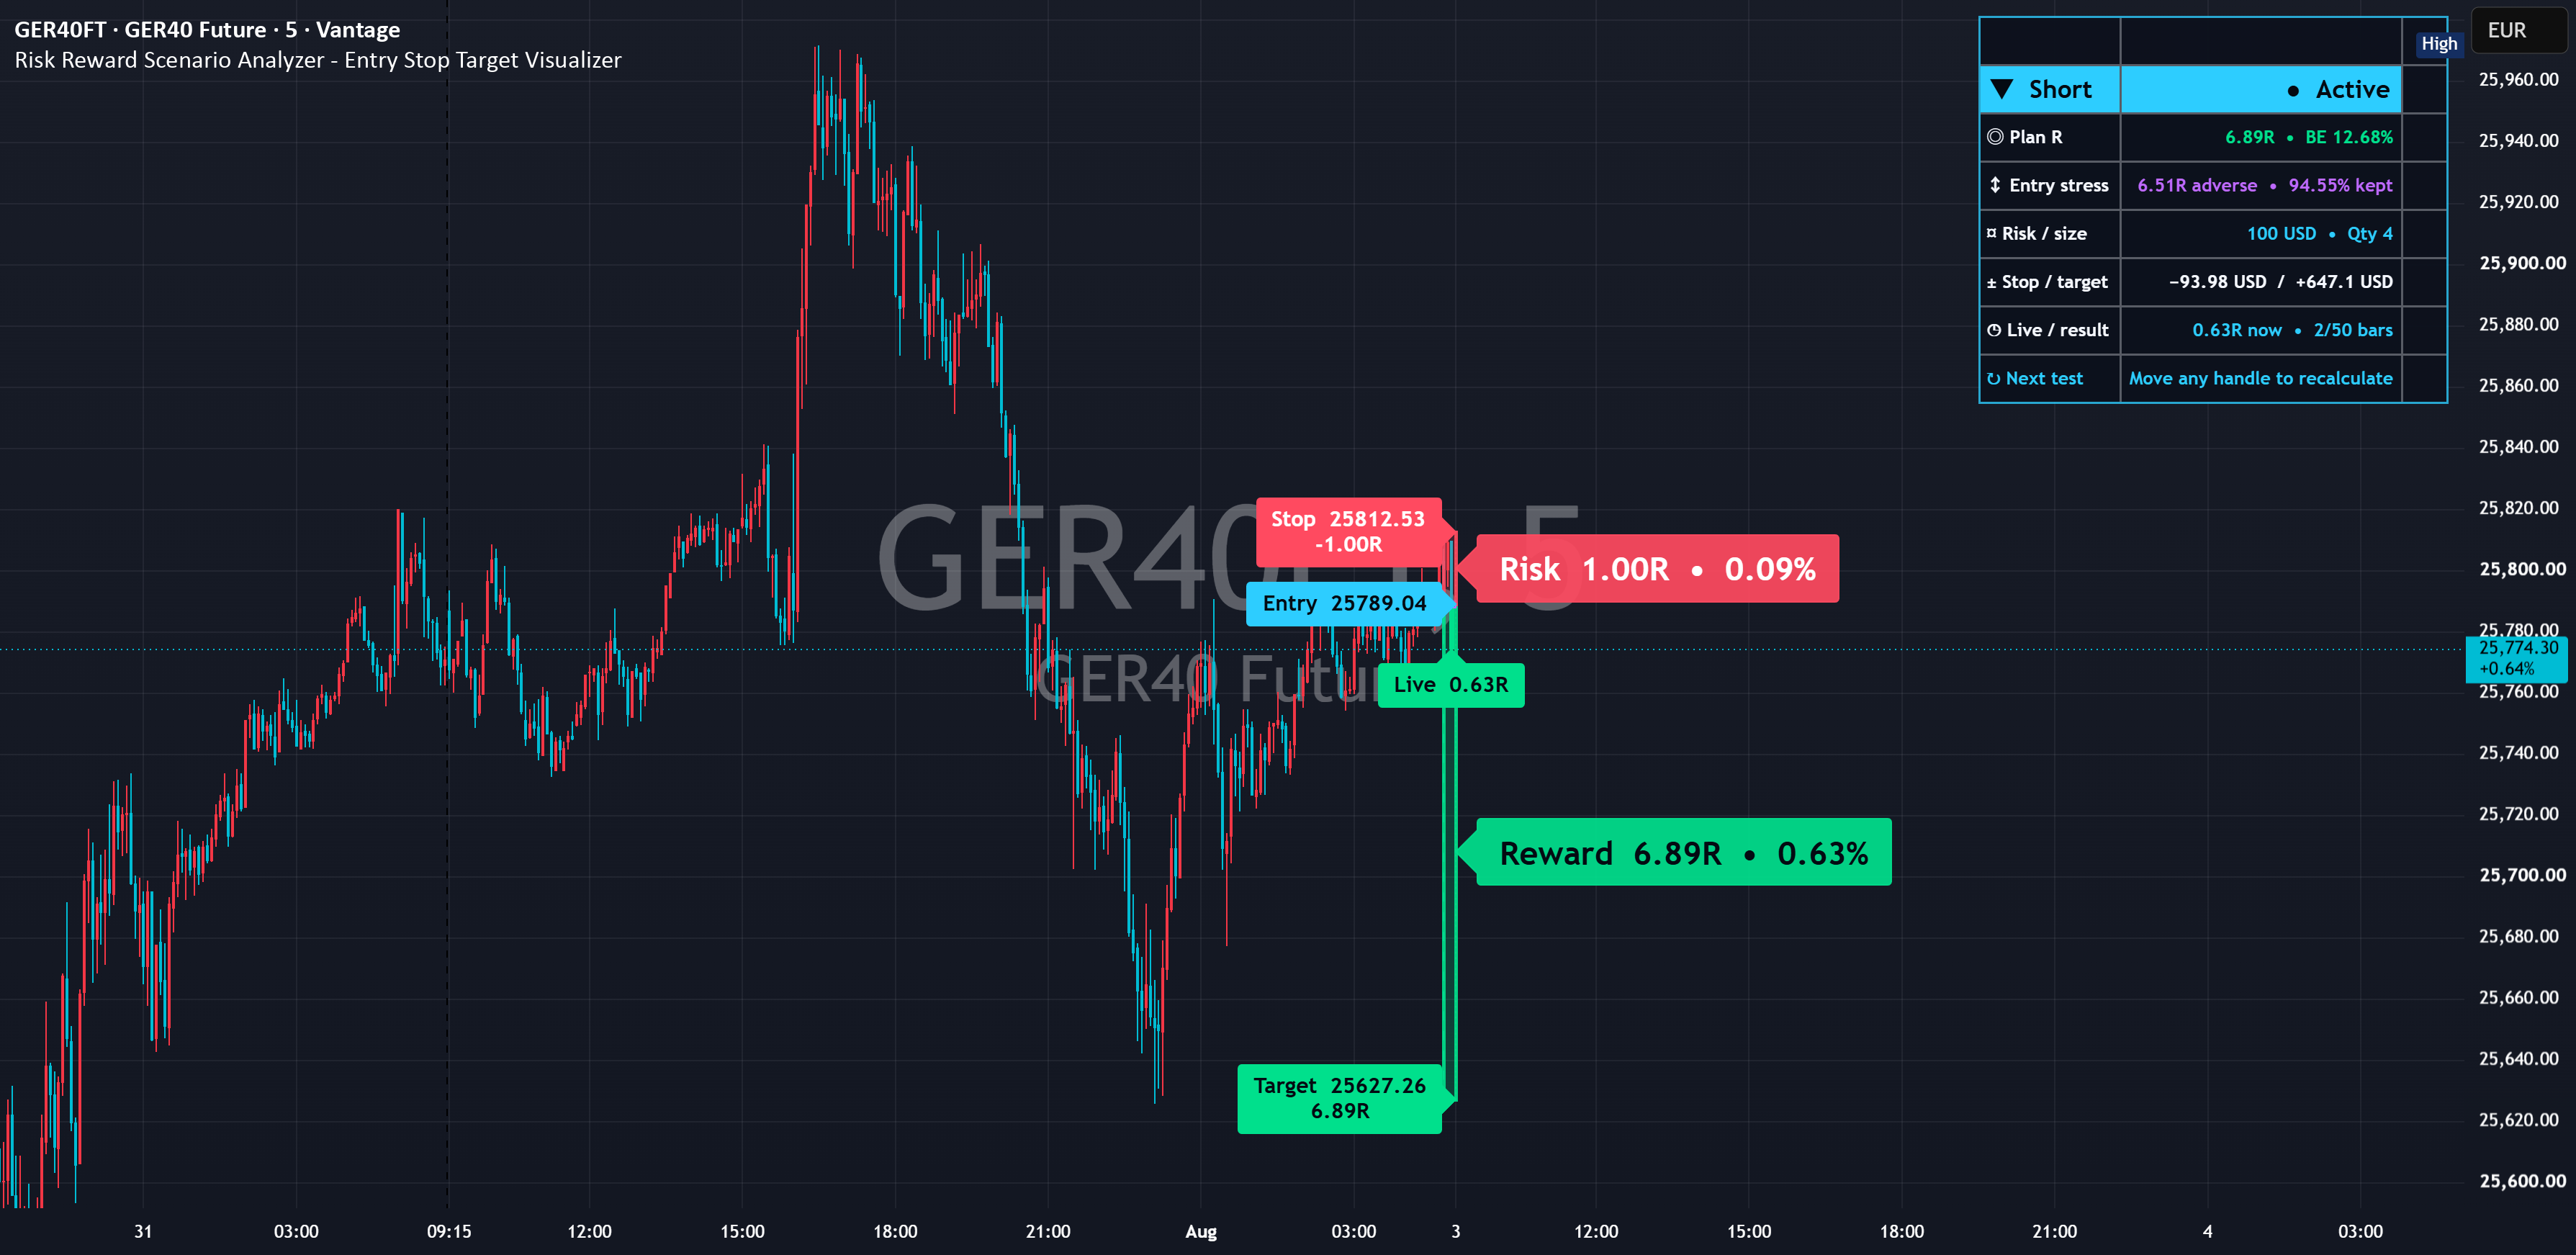
Real chart published on TradingView: Risk Reward Scenario Analyzer - Entry Stop Target Visualizer
Real chart image from the published TradingView page. The symbol, timeframe, settings and prices shown are a captured example, not current data or a trading result.
PurposeVisualize and compare a manual trade scenario
Best forTraders inspecting reward-to-risk and pre-execution assumptions
Primary outputRisk/reward boxes, R multiple, outcome and scenario readout
Chart placementPrice-chart overlay
01 — Overview

Audit the assumptions behind Entry, Stop and Target

A scenario-research indicator that uses four interactive points to validate Long or Short geometry and treats Entry-to-Stop distance as 1R. It does not select direction or levels and does not connect to accounts, orders or positions.

What it visualizes

Entry, Stop and Target lines and labels; risk and reward boxes; an entry-tolerance band; planned, live or terminal R; mathematical break-even win rate; elapsed bars; MFE and MAE; stop/target outcome; and optional arithmetic risk-budget and quantity estimates.

How it works

Valid Long geometry is Stop below Entry below Target; valid Short geometry reverses that order. Planned R divides target distance by stop distance, and break-even win rate is a mathematical no-cost value. After activation, confirmed chart-bar OHLC tracks first touch. A bar touching both levels is handled as ambiguous or by an explicit stop-first or target-first assumption.

The user defines the geometry

Auto direction only reads the ordering of three manually placed prices. Invalid arrangements remain visible for correction but are not processed as valid scenarios.

Planned R and entry stress are separate

Planned R uses the selected Entry. Entry stress applies favorable and adverse drift as a percentage of planned risk, ticks, or an ATR fraction. It does not forecast spread, slippage or fills.

Outcome uses confirmed OHLC

The activation bar is excluded because OHLC cannot establish its intrabar order. A later bar touching both levels remains unknowable; any forced order is an explicit research assumption.

02 — Install and start

Add it to TradingView

Add the public script to a standard candlestick chart, then manually place Entry, Anchor, Stop and Target. Identify the source of all three levels, both boxes and the readout before changing defaults.

Risk Reward Scenario Analyzer – Entry Stop Target Visualizer

Open the public Risk Reward Scenario Analyzer – Entry Stop Target Visualizer page and add it to a TradingView chart. No SG Group account is required.

  1. Open the “Use on TradingView” link below.
  2. Select “Use on chart” on TradingView to add the script to your chart.
  3. Open the gear icon, then Settings → Inputs, and observe the default configuration first.
  4. Change one input at a time for the symbol and timeframe you are studying.
Observe the defaults firstChange one input at a timeVerify symbol, timeframe and feed

Prevent misreads when indicators overlap

Overlapping lines, bands, backgrounds or tables can be duplicate drawings of the same kind of information. Never treat visual overlap by itself as stronger evidence or signal agreement. Other risk/reward drawings, Long/Short position tools, order lines, stop/target levels, horizontal levels, ATR stops, break-even lines and fixed panels can obscure which price and quantity belong to this manual scenario. Coincidence does not prove an order state or stronger evidence.

  • Hide other risk/reward, position, order, stop and target drawings while identifying this study’s Entry, Stop and Target.
  • If real orders remain visible, deliberately separate this study’s colors, widths and labels so manual scenario prices cannot be mistaken for fills.
  • Enable the tolerance band, R marker and readout one at a time; move or hide ATR-stop, break-even and sizing panels that share the area.
  • Do not count coincident lines or similar quantities as multiple confirmations. Toggle each study off to verify the source and inputs.
03 — How to read it

A practical reading order

Do not judge a plan from planned R alone. Verify geometry, activation, entry-drift assumptions, same-bar ambiguity, cost inputs and quantity assumptions in sequence.

Verify geometry and direction first

Confirm that Entry, Stop and Target satisfy the selected Long or Short ordering. Color and vertical position are not a directional signal.

Separate planned R from stress

Read planned R and the mathematical break-even win rate, then compare favorable and adverse entry drift. Personal minimum and preferred R are user thresholds, not recommendations.

Check activation, outcome and inputs

Identify anchor-fill or entry-touch activation, Stop, Target, Ambiguous or Expired outcome, then verify point value, costs, slippage and quantity step behind any cash or size estimate.

Status and display terms

Long / Short / Invalid geometry

Valid Long ordering, valid Short ordering, or an arrangement that remains visible for correction but is not researched.

Plan R / BE

Planned reward distance divided by planned risk / mathematical no-cost break-even win rate; not a forecast.

Active / Stop / Target / Ambiguous / Expired

Research is active, Stop or Target resolved first, both were touched in one bar, or the horizon ended.

Entry stress / kept

R under favorable or adverse hypothetical entry drift / percentage of planned R retained after that drift.

Risk / size

Arithmetic quantity from the manual risk budget and point-value assumptions; not a recommended order size.

MFE / MAE

Maximum favorable / adverse excursion after activation; not a recommended future target or stop.

Live / terminal R

Current or resolved price displacement expressed in planned-risk units; not brokerage P&L.

04 — Settings reference

Settings reference

The labels below match the published script’s English Inputs panel. Defaults reflect the public source at the time of review and may change in a later TradingView update.

On small screens, each input is reformatted as a readable stacked card.

1. Quick next-scenario workflow

2 inputs
Input labelDefault / optionsWhat it controls and when to adjust it
After a scenario resolvesCompact result; options: Keep full scenario | Compact result | Clear completed visualsChooses whether a resolved scenario keeps all drawings, collapses to a compact result, or clears completed visuals. It does not create a permanent trade journal.
Show next-scenario cuetrueShows a reminder to move an interactive handle before researching the next scenario. It does not affect calculations or outcome logic.

2. Interactive trade plan

5 inputs
Input labelDefault / optionsWhat it controls and when to adjust it
EntryInteractive price; user-definedSets the manually planned entry price through an interactive chart point or input. It does not read an order, fill, or brokerage position.
AnchorInteractive time; user-definedSets the time anchor from which scenario research begins. Moving it recalculates the scenario from available chart history.
Stop lossInteractive price; user-definedSets the manually assumed stop price. It does not create, modify or transmit an order and does not guarantee a fill at the displayed level.
Take-profit targetInteractive price; user-definedSets the manually assumed take-profit price. It is a user-defined research condition, not a forecast or recommended target.
DirectionAuto from geometry; options: Auto from geometry | Long | ShortUses price geometry automatically or forces Long or Short. Valid Long geometry is Stop below Entry below Target; valid Short geometry reverses that order.

3. Scenario research

10 inputs
Input labelDefault / optionsWhat it controls and when to adjust it
ActivationAssume filled at anchor; options: Assume filled at anchor | Wait for entry touchActivates immediately at the anchor or waits for a later confirmed chart bar to touch Entry. This is a research convention based on bar OHLC.
Research horizon (bars)50; range: 1-500Sets the maximum post-activation bars used to inspect stop/target outcome, MFE, MAE and live or terminal R. Horizon expiry is not a forecast.
When stop and target are touched in one barMark ambiguous; options: Mark ambiguous | Assume stop first | Assume target firstHandles a bar whose range touches both levels by marking it ambiguous or applying an explicit stop-first or target-first research assumption. OHLC cannot recover the true intrabar order.
ATR length14Sets the ATR lookback used only when entry tolerance is expressed as an ATR fraction. It does not choose Stop or Target.
Personal minimum R multiple1.0Sets a personal display threshold for comparing planned R. It is not a recommendation, pass/fail rule, or profit probability.
Personal preferred R multiple2.0Sets a personal preferred display threshold for planned R. It is not an optimum or an estimate of future performance.
Entry execution tolerance modePercent of planned risk; options: Percent of planned risk | Ticks | ATR fractionExpresses hypothetical entry drift as a percentage of planned risk, ticks, or an ATR fraction. It does not predict spread, slippage, or fills.
Tolerance (% of planned risk)5.0Sets favorable and adverse hypothetical entry drift as a percentage of the planned Entry-to-Stop distance when that tolerance mode is selected.
Tolerance (ticks)2.0Sets favorable and adverse hypothetical entry drift in the symbol's minimum ticks. It does not reproduce actual execution conditions.
Tolerance (ATR fraction)0.05Sets favorable and adverse hypothetical entry drift as a fraction of ATR, so the tolerance changes with volatility and the selected ATR length.

4. Risk budget and execution costs

11 inputs
Input labelDefault / optionsWhat it controls and when to adjust it
Risk budget modePercent of account; options: Percent of account | Fixed cash amountDerives the research risk budget from a percentage of a manually entered account size or a fixed cash amount. It does not read Trading Panel or brokerage balances.
Account size10000Sets the manually entered account value used by percentage risk mode. It is not synchronized with a broker and receives no currency conversion.
Account risk (%)1.0Sets the percentage of the entered account size used as the arithmetic risk budget. It is not a recommended or safe risk percentage.
Fixed risk amount100Sets the manually entered cash risk budget for fixed-amount mode. Account currency is not detected or converted.
Account currency labelUSDSets a display-only currency label. It performs no FX conversion, tax, funding, or margin calculation.
Value per 1.0 price pointSymbol point value; options: Symbol point value | Custom point valueUses the symbol's point value or a manual value for one price point. Contract multipliers and broker specifications still require independent verification.
Custom point value1.0Sets the manual cash value of a 1.0 price move per unit. Quantity and cash estimates will be wrong if it does not match the instrument specification.
Include estimated costsfalseIncludes manually assumed round-trip unit cost and per-side slippage in arithmetic estimates. It does not retrieve actual fees or spread.
Round-trip cash cost per unit0Sets a manually estimated round-trip cash cost per unit. Variable spread, fees and taxes must be evaluated separately.
Slippage ticks per side0Sets assumed slippage ticks on each entry and exit side. It does not reproduce liquidity, gaps, or actual fill sequencing.
Quantity step1.0Sets the step used to round the arithmetic quantity down. It does not retrieve broker minimums and is not a recommended order size.

5. Visual design

14 inputs
Input labelDefault / optionsWhat it controls and when to adjust it
Show risk and reward boxestrueShows the Entry-to-Stop risk area and Entry-to-Target reward area. Hide duplicate risk/reward drawings from other tools.
Show entry execution tolerance bandtrueShows the favorable and adverse hypothetical entry-drift band. It is not spread or an executable fill range.
Show box texttrueShows R and percentage text inside the boxes. Hide it when labels or panels overlap.
Show entry / stop / target labelstrueShows labels for the manually planned Entry, Stop and Target. They are research levels, not order tickets.
Show live or terminal R markertrueShows current R while active or terminal R after resolution. It is not an exit instruction.
Box transparency80Sets risk/reward box transparency. Increase it when candles or another overlay are obscured.
Level line width2Sets the width of Entry, Stop and Target level lines. Use a width distinguishable from other horizontal-level studies.
RewardGreenSets the reward-area and target-side color. Green does not mean buy or predict a target hit.
RiskRedSets the risk-area and stop-side color. Red does not mean sell or indicate an order state.
EntryBlueSets the planned Entry color. Distinguish it from real orders or filled-price drawings.
NeutralGraySets the neutral or unresolved display color. It carries no directional conclusion.
TolerancePurpleSets the hypothetical entry-tolerance color. It is not an executable price range.
TextWhiteSets annotation and panel text color. Keep sufficient contrast against boxes and the chart.
PanelDarkSets the scenario-readout background. Move or hide a panel when another fixed table occupies the same corner.

6. Scenario readout

3 inputs
Input labelDefault / optionsWhat it controls and when to adjust it
Show scenario readouttrueShows direction, state, planned R, break-even win rate, entry stress, risk budget, arithmetic quantity, live or terminal R, and elapsed bars.
Readout positionTop right; options: Top right | Middle right | Bottom right | Top left | Bottom leftPlaces the readout at top right, middle right, bottom right, top left, or bottom left. Separate it from other indicator panels.
Readout text sizeSmall; options: Tiny | Small | NormalSets Tiny, Small, or Normal readout text. Do not reduce it until values become hard to read or cells are clipped.
05 — Alerts

Factual scenario activation, outcome and horizon alerts

Alerts report configured events such as activation, stop first, target first, ambiguous same-bar touch or horizon expiry. They are not orders or recommendations and must be created separately in TradingView.

  • Scenario activation reports immediate anchor activation or a later confirmed Entry touch under the selected mode.
  • Stop reached, Target reached and both touched report confirmed-bar research outcomes. A same-bar event does not reconstruct true intrabar order.
  • Research horizon expired reports that no configured terminal result occurred inside the selected number of bars. It does not recommend what comes next.
06 — Limitations and responsible use

Not a buy/sell signal

This tool is for analysis and visualization. It is not investment advice, a trade recommendation, a forecast, or a promise of profit or accuracy. Results depend on inputs, symbol, timeframe, and data feed. You remain responsible for every trading decision.

No order or account connection

The study does not read Trading Panel data, brokerage balances, orders or positions, and it cannot place, modify or close an order. All levels are user-defined research inputs.

Intrabar order and gaps are models

Confirmed OHLC cannot establish the path inside a bar. Same-bar handling and gap-open treatment are research conventions, not guaranteed fill reconstruction.

Quantity and costs are input-dependent arithmetic

Estimated quantity is not recommended, optimal or safe. Point value, multiplier, fees, spread, slippage, currency conversion, taxes, funding and margin terms require independent verification.

Synthetic bars can distort execution meaning

Heikin Ashi, Renko, Kagi, Line Break and Point & Figure can contain synthetic OHLC. Standard candlesticks are recommended, and moving an interactive point recalculates from available history rather than storing a permanent journal.

Important

This indicator visualizes a user-authored scenario and organizes arithmetic plus confirmed-bar outcome history. It does not recommend or predict direction, Entry, Stop, Target, size, win rate or profit, and it cannot execute orders. Do not count planned R, break-even rate, entry stress and outcome as independent signals.

07 — FAQ

Frequently asked questions

Clarify the difference between a manual scenario and an order, planned R, same-bar ambiguity, and quantity/cost assumptions.

Is Risk Reward Scenario Analyzer – Entry Stop Target Visualizer free to use?

Yes. It is a free, open-source indicator published by SG Group on TradingView. Review TradingView’s terms and the conditions attached to the public script before reuse or redistribution.

Should I change the settings immediately?

Start with the published defaults and observe the drawings and state changes first. Then change one input at a time for the symbol, timeframe and data feed so you can identify what caused each visual change.

Can I display it with other indicators?

Yes, but similar lines, bands, backgrounds and tables can overlap and obscure their source. Isolate each indicator first and hide duplicate components. Visual overlap alone is not stronger evidence or signal agreement.

Does the display provide trade signals?

No. It is analysis and visualization context consistent with the public description. It does not provide entries, exits, targets, stops, price forecasts, or promises of profit, win rate or accuracy.

Does moving Stop or Target modify an order?

No. The indicator does not connect to Trading Panel, a brokerage account, orders or positions. Interactive points are research inputs; moving one recalculates the scenario from available chart history.

Source basis and update policy

This guide is grounded in SG Group’s live catalogue, the script’s published TradingView description, and the user-facing inputs in its open source. Labels and defaults can change after a script update.