

ROC Momentum – Pace and Sensitivity | TradingView Free Indicator
FreeOpen sourcePine Script v6
TradingView Free Indicator
Rising ROC does not necessarily mean the latest price rose. Keep ordinary rate of change intact while separating new-price effects from an expiring comparison base, then inspect pace and dependence on individual or clustered moves.
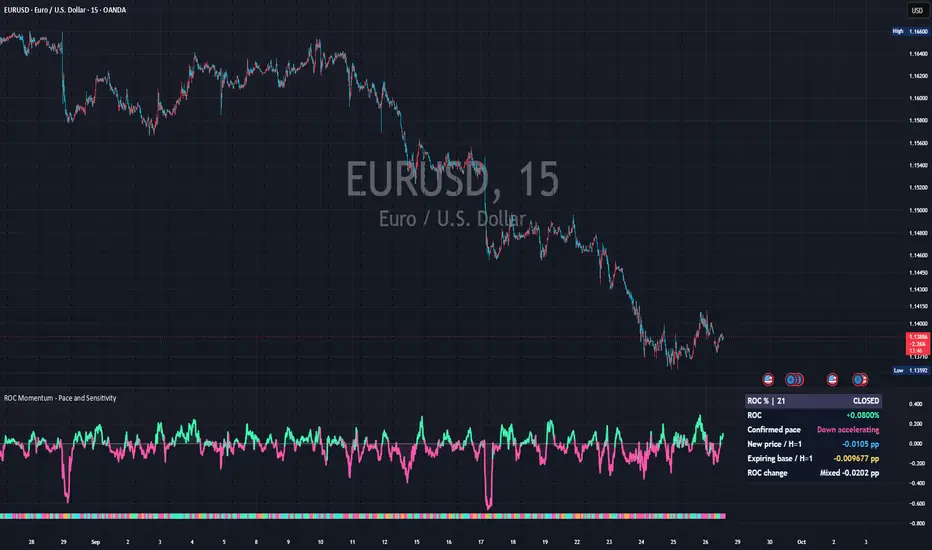
The same ROC can conceal different pace and historical dependence
A descriptive research indicator built around unsmoothed arithmetic ROC. It distinguishes new-price movement from base expiry and tests zeroing observed returns or explicit hypothetical future conditions. It does not place trades, forecast prices or estimate win rates.
What it visualizes
Default main-line colors are green for positive ROC, pink for negative and neutral near numerical zero. The strip uses green for up accelerating, cyan for up easing, pink for down accelerating, orange for down easing and purple for steady. Whole-window ROC sign and segment pace are different: positive ROC can coexist with down-accelerating pace.
How it works
ROC = 100 × (current price / price N bars ago − 1). One-bar log returns are 10,000 × ln(current / previous price), in log basis points. Their sum supports attribution and sensitivity calculations. Arithmetic percent, percentage points and log basis points are not interchangeable.
Three segments and acceleration
Split N returns into three adjacent segments, assigning extra bars to newer segments. Each pace is its mean log return per bar. Acceleration is recent minus middle pace divided by the distance between their centers, in log bp per bar squared, not the one-bar slope of ROC.
Symmetric replacement attribution
Let G = P(t−H)/P(t−N−H), a = P(t)/P(t−H), and b = P(t−N−H)/P(t−N). New-price contribution is 50G(a−1)(1+b); expiring-base contribution is 50G(b−1)(1+a). Their sum equals the observed H-bar ROC change in percentage points. Averaging the two application orders allocates the interaction symmetrically; it is not unique economic causation or order flow.
An unchanged price can lift ROC
For prices 100, 98, 99, 101, 101 and N = 3, the final unchanged price moves ROC from 1% to about 3.0612%. The comparison price falls from 100 to 98. New-price contribution is zero and the increase is entirely base expiry.
Held-price baseline is a different decomposition
The baseline is 100 × (price H bars ago / current N-bar base − 1). Actual minus baseline is the price effect at the current base; baseline minus old ROC is the base-only effect. This sequential decomposition legitimately differs from symmetric attribution.
Individual and arbitrary removal
Removal sets observed log returns to zero while retaining timestamps and window length; it does not delete real bars. Distinguish the full individual-omission range, omission of the largest direction-aligned move, and the smallest arbitrary aligned-move count that erases the original sign. Exact two/three-move tests require enough eligible moves.
Contiguous blocks include opposing moves
A contiguous omission zeroes every return inside the block, including opposing moves. Equal shortest candidates select the most recent block; age zero is latest at the selected snapshot. Fixed B tests all N−B+1 blocks and remains defined for a flat net, while original-sign erasure counts do not.
Expiry requirements are endpoint conditions
After K bars, the log sum equals retained history plus unknown future K returns. Preserving current ROC needs a future sum equal to the outgoing returns; reaching zero needs the negative retained sum. Divide by K for mean log pace. Endpoint conditions do not require identical future returns and are not forecasts.
Endpoint and all-close preservation differ
Path stress assumes the same g on every future bar. At step j the sum is retained[j] + jg. For an originally positive sign the mathematical all-close boundary is max(−retained[j]/j); for a negative sign it is the minimum. Strictly beyond the correct side preserves mathematical sign; equality touches zero at a binding step. Another path with the same average need not preserve sign.
Concentration and gap/body
Concentration is squared total absolute log movement divided by squared-return sum: N for equal nonzero moves, 1 for one isolated move, and 0 for all-flat returns. It is not independent sample size. For Close, log(Open/previous Close) plus log(Close/Open) separates gap and body in log percentage points; a gap is not necessarily overnight.
Add it to TradingView
Start with standard candles, Close, N = 21, attribution H = 1, expiry K = 5 and contiguous block B = 3. Read ROC sign separately from the bottom pace strip. H, K and B serve independent roles and are each capped at N.
ROC Momentum – Pace and Sensitivity
Open the public ROC Momentum – Pace and Sensitivity page and add it to TradingView. No SG Group registration is required.
- Open the “Use on TradingView” link below.
- Select “Use on chart” on TradingView to add the script to your chart.
- Open the gear icon, then Settings → Inputs, and observe the default configuration first.
- Change one input at a time for the symbol and timeframe you are studying.
Prevent misreads when indicators overlap
Overlapping lines, bands, backgrounds or tables can be duplicate drawings of the same kind of information. Never treat visual overlap by itself as stronger evidence or signal agreement. Main line, comparisons, fills and contributions derive from the same ROC and are not independent confirmations. Check each view’s units and legend before overlaying indicators.
- Use a separate pane and match source, N and closed-bar timing against ordinary ROC.
- Read main-line sign colors separately from categorical acceleration/easing strip colors.
- Do not treat disagreement between sequential held-price effects and symmetric attribution as an error.
- Enable fills, omission ranges and markers one at a time; place tables away from other indicators.
A practical reading order
Begin with overview, then window replacement, then sensitivity or hypothetical requirements. Each of the seven views uses a consistent unit; do not compare plots from different views as if their scales were identical.
Overview: level versus strip
ROC overview is arithmetic percent. Default pace confirmation requires two consecutive closed raw states, adding one bar to a persistent change. The first valid state initializes immediately; interrupted changes may never confirm. Numerical ROC and pace are not smoothed or shifted.
Removal and segment pace
Removal sensitivity compares actual and omitted-return ROC in arithmetic percent. Segment pace uses log bp per bar for recent, dashed middle and dotted oldest segments. Sensitivity to a large observed move is not a reversal probability.
Replacement and held baseline
Window replacement shows ROC change, blue new-price and yellow expiry contributions in percentage points. Price-held baseline is arithmetic percent. Expiry conflict includes ROC change opposing the H-bar price return, including a numerically flat price with changing ROC.
Requirements and gap/body
Expiry requirements uses mean log bp per bar to preserve current ROC or reach zero. The difference between these requirements is the current N-return log sum divided by K, not independent evidence. Gap and body requires Close and valid positive Open and uses log percentage points.
Snapshot research pages
Sensitivity, Cluster stress and Path stress directly scan the selected snapshot. Read arbitrary counts, contiguous spans, fixed-B ranges, scenario endpoint, first loss and weakest signed margin with its step. These are not full historical backtest series.
Flat future versus constant pace
A flat-future first sign loss does not imply permanent loss; the original sign can return later. Zero after N flat bars is an identity. Path loss treats signed margin within 0.000001 log bp of zero as lost. Rounded approximate boundaries are not exact cutoffs, and display precision does not change classification.
Historical inspection changes the table only
The cutoff selects the last loaded closed bar at or before it. The readout does not track the crosshair; plots and live alerts remain unchanged. Check AS OF time and timezone. A cutoff before loaded history is unavailable, not silently replaced by a later observation.
Diagnostics check arithmetic
Diagnostics covers identities, snapshot alignment and P01–P08 checks of prices, sums, omissions, expiry, requirements, blocks and paths. The public description documents 13 deterministic initialization tests. These are internal checks, not TradingView certification; PASS and CLOSED do not certify profitability.
Status and display terms
Positive pace accelerating / easing; separate from ordinary ROC sign.
Negative pace accelerating / easing / steady or near zero; not labels for one-bar ROC change.
New-price-led / base-expiry-led / mixed / offsetting. The default 65% dominance is not confidence.
Numerically negligible change, not a trading recommendation.
Endpoint-zero condition / boundary for preserving sign at every close; different questions.
First original-sign loss / weakest signed margin. Negative means opposite sign; tolerance matters.
Inspected timestamp / closed observation, not crosshair tracking or external certification.
Internal check passed / unavailable. Neither means guaranteed profit, and unavailable is not zero.
Settings reference
The labels below match the published script’s English Inputs panel. Defaults reflect the public source at the time of review and may change in a later TradingView update.
On small screens, each input is reformatted as a readable stacked card.
01 – Calculation
11 inputs| Input label | Default / options | What it controls and when to adjust it |
|---|---|---|
Price source | Close / options: Close, Open, High, Low, HL2, HLC3, OHLC4 | Price series: Close, Open, High, Low or the listed price averages. Non-Close scenarios refer to the selected series, not necessarily closing prices. |
ROC lookback | 21 / min 3, max 600 | ROC comparison window N, initially 21 bars, not calendar days. |
Fixed contiguous block: B moves | 3 / min 1, max 600 | Width B of a contiguous block whose returns are set to zero; capped at N. This is not arbitrary removal of separated moves. |
Hypothetical future pace: log bp/bar | 0 / min -1000, max 1000 | Constant hypothetical log pace g for each future bar, in log basis points per bar. Zero holds the source flat; this is not a forecast. |
Attribution span: H bars | 1 / min 1, max 600 | Observed attribution span H, initially one bar and capped at N, separating new-price and expiring-base contributions. |
Expiry requirement horizon: K bars | 5 / min 1, max 600 | Hypothetical expiry horizon K, initially five bars and capped at N. Independent of H and B. |
Pace-change tolerance (%) | 5 / min 0, max 100 | Pace-change deadband as a percentage of mean absolute one-bar log movement; not a significance level. |
Near-zero pace tolerance (%) | 2 / min 0, max 100 | Near-zero pace tolerance relative to mean absolute log movement; not an ROC trading threshold. |
Pace confirmation bars | 2 / min 1, max 5 | Consecutive closed raw states needed for a confirmed change. Initial valid state initializes immediately; ROC itself is not smoothed. |
Change-driver dominance (%) | 65 / min 51, max 95 | Dominance share of absolute contributions, initially 65%. Distinguishes price-led, expiry-led, mixed and offsetting; not predictive confidence. |
Display closed bars only | On | On leaves the forming bar blank and uses a closed snapshot. It does not extend the previous reading into that bar. Confirmations and alerts remain close-only when off. |
02 – Display
21 inputs| Input label | Default / options | What it controls and when to adjust it |
|---|---|---|
View | ROC overview / options: ROC overview, Removal sensitivity, Segment pace, Window replacement, Price-held baseline, Expiry requirements, Gap and body | Select the research view: overview, removal sensitivity, segment pace, replacement attribution, held-price baseline, expiry requirements, or gap/body. Each view uses its own consistent unit. |
ROC main-line color | ROC sign / options: ROC sign, Confirmed pace, Single color | Color the main line by ROC sign, confirmed pace, or a single color without changing its values. |
Show omission line in overview | Off | Add the largest direction-aligned one-move omission line to overview; unavailable for a numerically flat net change. |
Show comparison in research views | On | Enable comparison plots in research views; read the selected view and units to identify the comparison. |
Show one-bar omission range | Off | Show the range over individual one-move omissions, not a confidence or forecast band. |
Show faint ROC-to-zero fill | On | Faintly fill between ROC and zero; no additional signal. |
Fill actual / price-held baseline | On | Fill between actual ROC and the price-held baseline. |
Fill main/comparison difference | Off | Fill the main/comparison difference; distinguish overlapping fills with the legend and toggles. |
Show bottom state strip | On | Show the categorical strip at the bottom; its height does not encode ROC magnitude. |
Bottom strip meaning | Confirmed pace / options: Confirmed pace, Replacement driver | Choose confirmed pace or replacement driver for the strip, independently of main-line coloring. |
Show subtle line glow | Off | Add a subtle glow; visual only. |
Show zero guide | On | Show the zero guide in the selected view’s units. |
Main line width | 3 / min 1, max 5 | Main-line width, initially 3; adjust for legibility. |
Fill transparency | 92 / min 80, max 98 | Fill transparency; higher values are more transparent. |
Color theme | Auto contrast / options: Auto contrast, Vivid dark, Light contrast, Custom | Automatic contrast, vivid dark, light contrast, or custom palette. |
Show five-metric readout | On | Show the five-metric readout; check units and effective parameters. |
Readout page | Follow view / options: Follow view, Sensitivity, Cluster stress, Path stress, Expiry requirements, Return details, Diagnostics, Legend | Choose the view-following readout, sensitivity, cluster stress, path stress, expiry requirements, return details, diagnostics or legend. |
Readout position | Top right / options: Top right, Bottom right, Top left, Bottom left | Place the readout in a corner away from other indicator tables. |
Readout number precision | Adaptive / options: Adaptive, 2 decimals, 4 decimals, 6 decimals | Adaptive or fixed decimal precision. Formatting does not change calculations or classification; tiny nonzero values can use scientific notation. |
Readout text size | Normal / options: Small, Normal, Large | Readout text size: small, normal or large. |
Readout right padding (%) | 2 / min 0, max 10 | Right padding for the readout, initially 2%. |
03 – Inspection and events
5 inputs| Input label | Default / options | What it controls and when to adjust it |
|---|---|---|
Inspect a historical timestamp | Off | Inspect the last loaded closed bar at or before the cutoff in the readout only. Plots and live alerts are unchanged; this is not crosshair tracking. |
As-of timestamp | 2025-01-01 00:00 UTC | Inspection cutoff, initially 2025-01-01 00:00 UTC. Before loaded history is unavailable; verify the selected bar time and timezone in the readout tooltip. |
Event markers | Off / options: Off, Expiry conflict, One-bar sensitivity, ROC zero crossing, Pace change | Show no markers or markers for expiry conflict, one-bar sensitivity, zero crossing or pace change. Marker selection does not suppress alert conditions. |
Minimum bars between markers | 6 / min 1, max 100 | Minimum spacing between displayed markers; not alert throttling. |
Marker display history | 300 / min 50, max 5000 | Marker display history, initially 300 bars; not the ROC window. |
04 – Custom colors
9 inputs| Input label | Default / options | What it controls and when to adjust it |
|---|---|---|
Positive / up accelerating | #42F5AC | Custom positive ROC / up-accelerating color. |
Up easing | #41D8FF | Custom up-easing color. |
Negative / down accelerating | #FF55AD | Custom negative ROC / down-accelerating color. |
Down easing | #FFAD4D | Custom down-easing color. |
Steady / oldest pace | #AB9DFF | Custom steady-state / oldest-segment color. |
Comparison / expiry | #FFD15C | Custom comparison / expiry color. |
New-price / body | #42BAFF | Custom new-price / candle-body color. |
Text / single-color line | #F0F5FF | Custom text / single-line color; maintain contrast with the background. |
Readout background | #111827 | Custom readout background; maintain readable text contrast. |
Eight close-confirmed alert conditions
Valid core calculations and confirmed bars are required. Marker selection and spacing do not suppress these conditions. There are no predictive alerts for hypothetical future outcomes.
- ROC crossed above zero: ROC crosses above zero.
- ROC crossed below zero: ROC crosses below zero.
- Confirmed pace changed: The confirmed pace state changes.
- One-bar sign sensitivity appeared: Single-move omission newly permits loss of the original sign.
- One-bar omission sign became retained: Single-move omission becomes sign-retaining.
- Three-segment pace became rising: Three segment paces become a rising sequence.
- Three-segment pace became falling: Three segment paces become a falling sequence.
- Expiry-driven ROC and price conflict appeared: An expiry-driven disagreement between ROC and price appears.
Not a buy/sell signal
This tool is for analysis and visualization. It is not investment advice, a trade recommendation, a forecast, or a promise of profit or accuracy. Results depend on inputs, symbol, timeframe, and data feed. You remain responsible for every trading decision.
Closed-only leaves the forming bar blank
By default the forming plot is blank and the table uses a closed snapshot. Live display does not change close-only alerts or pace confirmation. Match source, N and observation time when comparing indicators.
Positive prices and continuous history
Nonstandard charts are disabled. Missing or nonpositive prices invalidate affected windows rather than being skipped. Attribution needs N+H valid intervals. Timeframe, sessions, history start and data revisions can change results.
Unavailable is not zero
Arithmetic-percent conversion has an absolute natural-log guard of 100; outside it the result is unavailable rather than clipped. Small nonzero values may use scientific notation. An approximate rounded boundary is not the exact classification threshold.
Core versus snapshot failures
Core failures suppress research lines, fills, strips, exports and events, while valid ordinary ROC is treated separately. Snapshot failures suppress snapshot research and direct attention to diagnostics; they do not alone invalidate otherwise valid core history. Residuals remain inspectable.
Historical dependence is not future resilience
Minimum arbitrary counts, shortest contiguous spans and concentration describe construction sensitivity, not independent samples, future robustness, continuation probability or trading performance. Distinguish the 32 continuous Data Window outputs from snapshot-only scans.
This is not an order-executing strategy, optimizer or automatic divergence detector. It uses no future-price observations or forecast price projections. Its research concerns selected history and explicit assumptions, not expected returns.
Frequently asked questions
Clarify the comparison base, units, omission candidates and hypothetical paths.
Why can unchanged price produce rising ROC?
The N-bar comparison base rolls forward too. A lower base raises ROC even if the newest price is unchanged; window replacement separates the effects.
Can positive ROC have down-accelerating pace?
Yes. ROC covers the whole window; pace classification compares segment means. They measure different properties.
Is the omission range a forecast band?
No. It zeroes historical log returns while retaining timestamps and window length. It does not delete actual bars.
Does a positive endpoint ensure every earlier close stays positive?
No. Path stress assumes a constant future g and separately checks intermediate sign loss.
Does the readout follow the crosshair?
No. Enable historical inspection and set a cutoff. Only the readout changes; plots and live alerts remain live.
Is it free?
Published source uses Mozilla Public License 2.0. Implemented features require no author-side access fee or external service; check license terms before reuse.
Source basis and update policy
This guide is grounded in SG Group’s live catalogue, the script’s published TradingView description, and the user-facing inputs in its open source. Labels and defaults can change after a script update.