Global Cash Market Open Close Handoff Sequence Guide | SG Group
Skip to content
Japanese page

FreeOpen sourcePine Script v6

TradingView Free Indicator

Convert six editable cash-market reference schedules into absolute open, break, resume and close timestamps. Consolidate simultaneous events into one vertical boundary and classify how the configured active-market set activates, gains overlap, hands off, releases overlap or deactivates.

Global Cash-Market Schedule
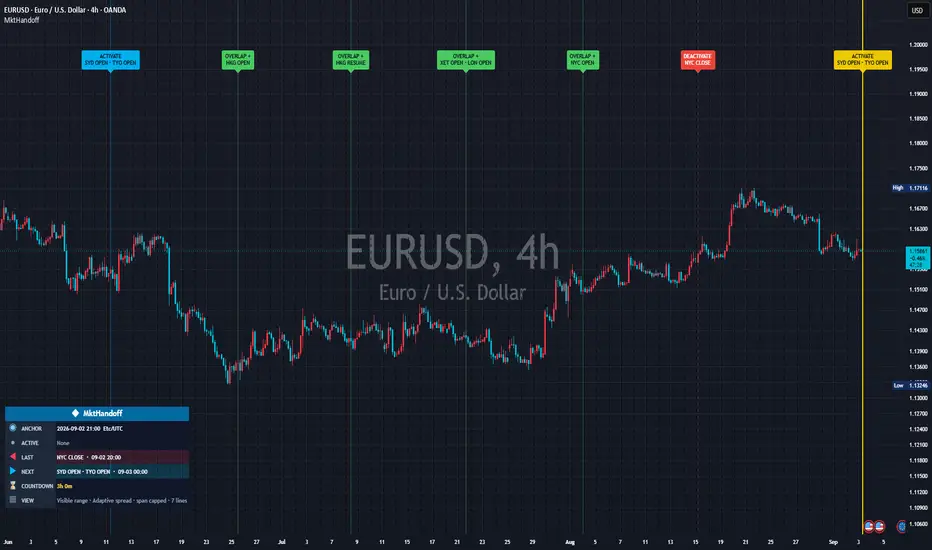
Real chart published on TradingView: Global Cash Market Open Close Handoff Sequence
Real chart image from the published TradingView page. The symbol, timeframe, settings and prices shown are a captured example, not current data or a trading result.
PurposeDescribe global cash-market boundary timing and active-market handoff sequence
Best forUsers examining time-zone transitions and simultaneous global cash-market handoffs
Primary outputConsolidated vertical boundaries, transition roles, event list, next boundary and Boundary Strip
Chart placementIntraday price-chart overlay
01 — Overview

Read the active-market state change, not merely the vertical line

At each unique timestamp the script consolidates scheduled OPEN, BREAK, RESUME and CLOSE events, then compares the active market-code set immediately before and after. It uses no price direction, session high/low, volume, volatility, external symbol, higher-timeframe data or future-price assumption.

What it visualizes

Historical and projected vertical boundaries, transition-role/event labels, next-boundary emphasis and a Boundary Strip containing anchor, active markets, last boundary, next boundary, countdown and view mode. Adaptive spread distributes retained lines when generated boundaries exceed the visual budget.

How it works

Each market has an IANA time zone, weekday string, primary segment and optional second segment. Separated segments create OPEN→BREAK→RESUME→CLOSE; touching or overlapping segments become one OPEN→CLOSE interval. Events at one absolute timestamp merge before the active-set transition is classified.

Simultaneous events become one structural boundary

When several markets open, close, break or resume at one absolute timestamp, one line is drawn. The label retains individual events and classification uses the complete configured state before and after.

HANDOFF means composition changed

If one market closes while another opens or resumes, the active count can stay constant while market identity changes. That is HANDOFF. Market codes must remain unique for unambiguous comparison.

Display retention does not change schedule logic

Adaptive spread samples already generated/classified boundaries across the research span. It does not change schedule timestamps, simultaneous consolidation, active state, role classification, Last or Next.

02 — Install and start

Add it to TradingView

Add the public script to an intraday chart. Under the defaults, identify the six-market boundary lines, transition-role labels, next boundary and lower-left Boundary Strip before changing one setting at a time.

Global Cash Market Open Close Handoff Sequence

Open the public Global Cash Market Open Close Handoff Sequence page and add it to a TradingView intraday chart. The default visible-right-edge study includes Sydney, Tokyo, Hong Kong, Xetra, London and New York cash-market reference hours. No SG Group account is required.

  1. Open the “Use on TradingView” link below.
  2. Select “Use on chart” on TradingView to add the script to your chart.
  3. Open the gear icon, then Settings → Inputs, and observe the default configuration first.
  4. Change one input at a time for the symbol and timeframe you are studying.
Observe the defaults firstChange one input at a timeVerify symbol, timeframe and feed

Prevent misreads when indicators overlap

Overlapping lines, bands, backgrounds or tables can be duplicate drawings of the same kind of information. Never treat visual overlap by itself as stronger evidence or signal agreement. A session highlighter, kill-zone study, exchange-open marker, date divider, economic-event line, opening range or manual vertical drawing can place lines and labels near the same timestamps. This study also intentionally consolidates simultaneous market events into one line, so line count is not event count.

  • Hide other session backgrounds, kill zones, market-open/close markers, date separators and news-event lines while identifying this study.
  • Switch Line color mode between Transition role and Market identity to distinguish role colors from market colors.
  • Inspect boundary-label and line budgets separately; display sampling is not missing schedule computation.
  • Move the Boundary Strip away from other fixed panels and toggle markets one at a time. Never count one consolidated timestamp as multiple confirmations.
03 — How to read it

A practical reading order

Do not treat a vertical line as a price signal. Read ACTIVATE, OVERLAP +, HANDOFF, OVERLAP -, DEACTIVATE or INTERNAL first, then identify the market-specific OPEN, BREAK, RESUME and CLOSE events that produced it.

Verify the effective anchor first

Visible range uses the right visible bar, not necessarily current real-world time. Panning or zooming rebuilds the processed window and retained display subset.

Read role, then underlying events

Identify ACTIVATE or another role, then read SYD OPEN, TYO BREAK, LON CLOSE and similar event text. Several events can share one consolidated line.

Confirm context in the Boundary Strip

Check ANCHOR, ACTIVE, LAST, NEXT, COUNTDOWN and VIEW. NEXT is a recurring reference schedule, not a holiday-aware assurance or price forecast.

Status and display terms

ACTIVATE / DEACTIVATE

Configured active-market set changes from none to active / active to none.

OVERLAP + / OVERLAP –

Configured active-market count rises / falls while at least one market remains active.

HANDOFF

Active-market count is unchanged but the configured market-code composition changes.

INTERNAL

A scheduled boundary occurs without a material change in the configured active-market set.

OPEN / BREAK / RESUME / CLOSE

Market start / split-session break / second-segment resume / final close; simultaneous events are consolidated.

ANCHOR / LAST / NEXT

Effective evaluation timestamp / preceding generated boundary / following scheduled boundary; anchor need not be realtime.

Adaptive spread / Nearest anchor

Distribute retained lines across the span / favor lines closest to the anchor; schedule calculations remain unchanged.

04 — Settings reference

Settings reference

The labels below match the published script’s English Inputs panel. Defaults reflect the public source at the time of review and may change in a later TradingView update.

On small screens, each input is reformatted as a readable stacked card.

1. Research Window

8 inputs
Input labelDefault / optionsWhat it controls and when to adjust it
Schedule scopeVisible range / options: Visible range, Recent daysVisible range rebuilds around the part of the chart you are studying. Recent days follows the selected anchor instead.
Maximum visible span to process (days)90 / min 3, max 365When the visible chart covers more than this span, the script retains the most recent portion ending at the right visible bar.
Past days10 / min 1, max 45Controls past days. Start with the published default and change one input at a time.
Recent-days anchorRight visible bar / options: Right visible bar, Latest chart bar, Real clockRight visible bar is suitable for historical study. Latest chart bar follows the dataset. Real clock follows timenow and can extend beyond the latest bar.
Future projection days2 / min 0, max 7Projects recurring reference boundaries forward from the effective anchor. This is a time schedule, not a price forecast.
Boundary Strip time zoneEtc/UTCUse a valid IANA identifier such as Etc/UTC, Asia/Tokyo, Europe/London, or America/New_York.
Show boundaries at or before anchorOnShows, hides or enables show boundaries at or before anchor. Start with the published default and change one input at a time.
Show projected boundaries after anchorOnShows, hides or enables show projected boundaries after anchor. Start with the published default and change one input at a time.

2. Boundary Labels

10 inputs
Input labelDefault / optionsWhat it controls and when to adjust it
Show boundary labelsOnShows, hides or enables show boundary labels. Start with the published default and change one input at a time.
Label contentRole + events / options: Role + events, Events only, Role onlyControls label content. Start with the published default and change one input at a time.
Label placementTop / options: Alternate, Top, BottomAlternate distributes labels between upper and lower lanes. Lane spacing reduces collisions without moving timestamps.
Lanes per side2 / min 1, max 4Controls lanes per side. Start with the published default and change one input at a time.
Minimum time spacing per lane (minutes)360 / min 15, max 1440, step 15Controls minimum time spacing per lane (minutes). Start with the published default and change one input at a time.
Maximum labels7 / min 1, max 80Keep this near the visible line budget. Labels are applied only to retained structural lines.
Text sizeSmall / options: Tiny, Small, NormalSmall is the readability-first default. Use Normal when the chart is displayed on a high-resolution screen or in a large publication image.
Bold label textOnUses Pine v6 text formatting to keep compact boundary captions legible against the chart.
Label background transparency8 / min 0, max 70Lower values create a more opaque caption background and stronger text contrast.
Include native local time in tooltipOnShows, hides or enables include native local time in tooltip. Start with the published default and change one input at a time.

3. Boundary Lines

11 inputs
Input labelDefault / optionsWhat it controls and when to adjust it
Standard line width1 / min 1, max 4Controls standard line width. Start with the published default and change one input at a time.
Visible line budget7 / min 3, max 120Adaptive spread uses this as the target number of real boundary timestamps. Increase it only when a denser research view is required.
Line retentionAdaptive spread / options: Adaptive spread, Nearest anchorAdaptive spread distributes retained boundaries across the displayed time span. Nearest anchor preserves the former dense research behavior around the effective anchor.
Line color modeTransition role / options: Market identity, Transition roleMarket identity preserves each market color. Transition role recolors lines by the active-market change across the timestamp.
Line style modeDirectional / options: Directional, UniformDirectional uses solid for open/resume, dotted for breaks, dashed for closes, and solid for merged timestamps.
Uniform styleSolid / options: Solid, Dashed, DottedControls uniform style. Start with the published default and change one input at a time.
Historical line transparency58 / min 0, max 85Controls historical line transparency. Start with the published default and change one input at a time.
Future line transparency44 / min 0, max 85Controls future line transparency. Start with the published default and change one input at a time.
Simultaneous-event colorrgba(255,193,7,1)Used when multiple tracked market events occur at the same absolute timestamp.
Emphasize next boundaryOnShows, hides or enables emphasize next boundary. Start with the published default and change one input at a time.
Next-boundary colorrgba(255,215,0,1)Sets the display color for next-boundary color. It changes presentation only, not event timestamps or classifications.

4. Handoff Classification

7 inputs
Input labelDefault / optionsWhat it controls and when to adjust it
Classify active-market transitionsOnCompares the configured active-market set immediately before and after each boundary. This is descriptive schedule logic, not a trading signal.
Activation (none to active)rgba(0,188,255,1)Sets the display color for activation (none to active). It changes presentation only, not event timestamps or classifications.
Overlap build (active count rises)rgba(76,217,100,1)Sets the display color for overlap build (active count rises). It changes presentation only, not event timestamps or classifications.
Handoff (same count, different markets)rgba(255,179,0,1)Sets the display color for handoff (same count, different markets). It changes presentation only, not event timestamps or classifications.
Overlap release (active count falls)rgba(175,82,222,1)Sets the display color for overlap release (active count falls). It changes presentation only, not event timestamps or classifications.
Deactivation (active to none)rgba(255,69,58,1)Sets the display color for deactivation (active to none). It changes presentation only, not event timestamps or classifications.
Internal boundaryrgba(100,116,139,1)Sets the display color for internal boundary. It changes presentation only, not event timestamps or classifications.

5. Boundary Strip

6 inputs
Input labelDefault / optionsWhat it controls and when to adjust it
Show Boundary StripOnShows, hides or enables show boundary strip. Start with the published default and change one input at a time.
PositionBottom left / options: Bottom left, Middle left, Top left, Bottom right, Middle right, Top rightBottom-left remains the default. A transparent clearance row lifts the visible panel above TradingView's permanent lower-left branding area.
Text sizeSmall / options: Tiny, Small, NormalSmall is the readability-first default for the fixed readout.
Bold panel textOnApplies bold formatting to the panel header, keys, values, and visual marks.
Bottom clearance (% of pane)4 / min 0, max 15, step 0.5Raises a bottom-anchored panel above the lower-left or lower-right chart furniture without moving it away from the corner. Set to zero to disable.
Show seconds when under one hourOffShows, hides or enables show seconds when under one hour. Start with the published default and change one input at a time.

6. Sydney Cash Reference

9 inputs
Input labelDefault / optionsWhat it controls and when to adjust it
EnableOnIncludes or excludes the Sydney Cash schedule from event generation and active-market classification.
CodeSYDSets the unique short code used to identify Sydney Cash in labels and active-set comparisons.
NameSydney CashSets the display name for Sydney Cash.
IANA time zoneAustralia/SydneySets the IANA time zone used to convert the local Sydney Cash schedule into absolute timestamps.
Active weekdays (1 Sun ... 7 Sat)23456Sets the active weekdays for Sydney Cash; 1 is Sunday and 7 is Saturday. Holidays are not fetched automatically.
Primary segment1000-1600Controls the editable local-time segment structure for Sydney Cash. Separated segments create BREAK and RESUME events.
Use second segmentOffControls the editable local-time segment structure for Sydney Cash. Separated segments create BREAK and RESUME events.
Second segment0000-0000Controls the editable local-time segment structure for Sydney Cash. Separated segments create BREAK and RESUME events.
Colorrgba(0,174,239,1)Sets the Sydney Cash identity color when Market identity color mode is used.

7. Tokyo Cash Reference

9 inputs
Input labelDefault / optionsWhat it controls and when to adjust it
EnableOnIncludes or excludes the Tokyo Cash schedule from event generation and active-market classification.
CodeTYOSets the unique short code used to identify Tokyo Cash in labels and active-set comparisons.
NameTokyo CashSets the display name for Tokyo Cash.
IANA time zoneAsia/TokyoSets the IANA time zone used to convert the local Tokyo Cash schedule into absolute timestamps.
Active weekdays (1 Sun ... 7 Sat)23456Sets the active weekdays for Tokyo Cash; 1 is Sunday and 7 is Saturday. Holidays are not fetched automatically.
Morning segment0900-1130Controls the editable local-time segment structure for Tokyo Cash. Separated segments create BREAK and RESUME events.
Use afternoon segmentOnControls the editable local-time segment structure for Tokyo Cash. Separated segments create BREAK and RESUME events.
Afternoon segment1230-1530Controls the editable local-time segment structure for Tokyo Cash. Separated segments create BREAK and RESUME events.
Colorrgba(238,61,190,1)Sets the Tokyo Cash identity color when Market identity color mode is used.

8. Hong Kong Cash Reference

9 inputs
Input labelDefault / optionsWhat it controls and when to adjust it
EnableOnIncludes or excludes the Hong Kong Cash schedule from event generation and active-market classification.
CodeHKGSets the unique short code used to identify Hong Kong Cash in labels and active-set comparisons.
NameHong Kong CashSets the display name for Hong Kong Cash.
IANA time zoneAsia/Hong_KongSets the IANA time zone used to convert the local Hong Kong Cash schedule into absolute timestamps.
Active weekdays (1 Sun ... 7 Sat)23456Sets the active weekdays for Hong Kong Cash; 1 is Sunday and 7 is Saturday. Holidays are not fetched automatically.
Morning segment0930-1200Controls the editable local-time segment structure for Hong Kong Cash. Separated segments create BREAK and RESUME events.
Use afternoon segmentOnControls the editable local-time segment structure for Hong Kong Cash. Separated segments create BREAK and RESUME events.
Afternoon segment1300-1600Controls the editable local-time segment structure for Hong Kong Cash. Separated segments create BREAK and RESUME events.
Colorrgba(245,158,11,1)Sets the Hong Kong Cash identity color when Market identity color mode is used.

9. Frankfurt / Xetra Main Cash Reference

9 inputs
Input labelDefault / optionsWhat it controls and when to adjust it
EnableOnIncludes or excludes the Frankfurt / Xetra Main Cash schedule from event generation and active-market classification.
CodeXETSets the unique short code used to identify Frankfurt / Xetra Main Cash in labels and active-set comparisons.
NameXetra Main CashSets the display name for Frankfurt / Xetra Main Cash.
IANA time zoneEurope/BerlinSets the IANA time zone used to convert the local Frankfurt / Xetra Main Cash schedule into absolute timestamps.
Active weekdays (1 Sun ... 7 Sat)23456Sets the active weekdays for Frankfurt / Xetra Main Cash; 1 is Sunday and 7 is Saturday. Holidays are not fetched automatically.
Primary segment0900-1730Controls the editable local-time segment structure for Frankfurt / Xetra Main Cash. Separated segments create BREAK and RESUME events.
Use second segmentOffControls the editable local-time segment structure for Frankfurt / Xetra Main Cash. Separated segments create BREAK and RESUME events.
Second segment0000-0000Controls the editable local-time segment structure for Frankfurt / Xetra Main Cash. Separated segments create BREAK and RESUME events.
Colorrgba(42,200,96,1)Sets the Frankfurt / Xetra Main Cash identity color when Market identity color mode is used.

10. London Cash Reference

9 inputs
Input labelDefault / optionsWhat it controls and when to adjust it
EnableOnIncludes or excludes the London Cash schedule from event generation and active-market classification.
CodeLONSets the unique short code used to identify London Cash in labels and active-set comparisons.
NameLondon CashSets the display name for London Cash.
IANA time zoneEurope/LondonSets the IANA time zone used to convert the local London Cash schedule into absolute timestamps.
Active weekdays (1 Sun ... 7 Sat)23456Sets the active weekdays for London Cash; 1 is Sunday and 7 is Saturday. Holidays are not fetched automatically.
Primary segment0800-1630Controls the editable local-time segment structure for London Cash. Separated segments create BREAK and RESUME events.
Use second segmentOffControls the editable local-time segment structure for London Cash. Separated segments create BREAK and RESUME events.
Second segment0000-0000Controls the editable local-time segment structure for London Cash. Separated segments create BREAK and RESUME events.
Colorrgba(111,91,255,1)Sets the London Cash identity color when Market identity color mode is used.

11. New York Cash Reference

9 inputs
Input labelDefault / optionsWhat it controls and when to adjust it
EnableOnIncludes or excludes the New York Cash schedule from event generation and active-market classification.
CodeNYCSets the unique short code used to identify New York Cash in labels and active-set comparisons.
NameNew York CashSets the display name for New York Cash.
IANA time zoneAmerica/New_YorkSets the IANA time zone used to convert the local New York Cash schedule into absolute timestamps.
Active weekdays (1 Sun ... 7 Sat)23456Sets the active weekdays for New York Cash; 1 is Sunday and 7 is Saturday. Holidays are not fetched automatically.
Primary segment0930-1600Controls the editable local-time segment structure for New York Cash. Separated segments create BREAK and RESUME events.
Use second segmentOffControls the editable local-time segment structure for New York Cash. Separated segments create BREAK and RESUME events.
Second segment0000-0000Controls the editable local-time segment structure for New York Cash. Separated segments create BREAK and RESUME events.
Colorrgba(255,59,92,1)Sets the New York Cash identity color when Market identity color mode is used.
05 — Alerts

No TradingView alerts are implemented

The published script contains no alertcondition() or dynamic alert() calls. It can emphasize the next boundary and display a countdown, but it does not send a notification or forecast price.

  • The published version has no TradingView alert conditions. Emphasize next boundary is visual only.
  • COUNTDOWN measures from the effective anchor, which may be a historical visible-right-edge timestamp rather than the real clock.
  • Do not interpret this guide as claiming notification functionality that the script does not provide.
06 — Limitations and responsible use

Not a buy/sell signal

This tool is for analysis and visualization. It is not investment advice, a trade recommendation, a forecast, or a promise of profit or accuracy. Results depend on inputs, symbol, timeframe, and data feed. You remain responsible for every trading decision.

This is not an official exchange calendar

It does not automatically model holidays, early closes, delayed opens, unscheduled closures, security halts, historical schedule changes, auctions or extended hours. Defaults are editable main cash-session references.

Projected boundaries are not forecasts or open guarantees

Future objects repeat configured weekday/time schedules and may appear on holidays. They predict neither price direction, volatility nor liquidity.

Visible-range study rebuilds with the viewport

Panning and zooming can change the right-edge anchor, processed window and retained subset. That is schedule-window reconstruction, not revision of a past price signal.

Intraday only and not instrument-native

Daily or higher charts show an intraday-required notice. The overlay can sit on any intraday symbol, but its boundaries remain configured cash-market references rather than the charted instrument’s automatically detected session.

Important

Roles, lines, labels, next boundary and countdown are related outputs from the same configured schedules. Do not count their coincidence as independent signals or relabel schedule timing as price direction, liquidity, reversal, continuation, entry or exit.

07 — FAQ

Frequently asked questions

Clarify anchor time, HANDOFF, simultaneous consolidation, daylight saving, projections, Adaptive spread, holidays and the intraday limitation.

Is Global Cash Market Open Close Handoff Sequence free to use?

Yes. It is a free, open-source indicator published by SG Group on TradingView. Review TradingView’s terms and the conditions attached to the public script before reuse or redistribution.

Should I change the settings immediately?

Start with the published defaults and observe the drawings and state changes first. Then change one input at a time for the symbol, timeframe and data feed so you can identify what caused each visual change.

Can I display it with other indicators?

Yes, but similar lines, bands, backgrounds and tables can overlap and obscure their source. Isolate each indicator first and hide duplicate components. Visual overlap alone is not stronger evidence or signal agreement.

Does the display provide trade signals?

No. It is analysis and visualization context consistent with the public description. It does not provide entries, exits, targets, stops, price forecasts, or promises of profit, win rate or accuracy.

Does the next projected market open guarantee that the exchange will open on that date?

No. Projections repeat configured weekdays and local times. They do not fetch holidays, early closes, unscheduled closures, auctions or historical schedule changes. Verify an official exchange calendar and edit the reference schedule when exact treatment is required.

Source basis and update policy

This guide is grounded in SG Group’s live catalogue, the script’s published TradingView description, and the user-facing inputs in its open source. Labels and defaults can change after a script update.