OBV Price Confirmation Chronology Guide | SG Group
Skip to content
Japanese page

FreeOpen sourcePine Script v6

TradingView Free Indicator

Compare when price and classical OBV set rolling high-side and low-side records, then classify each chronology as OBV led, Price led, Synchronized, Price only or OBV only. Markers, latest labels and a status table make price-volume record timing visible in a separate pane.

Volume / Price Confirmation
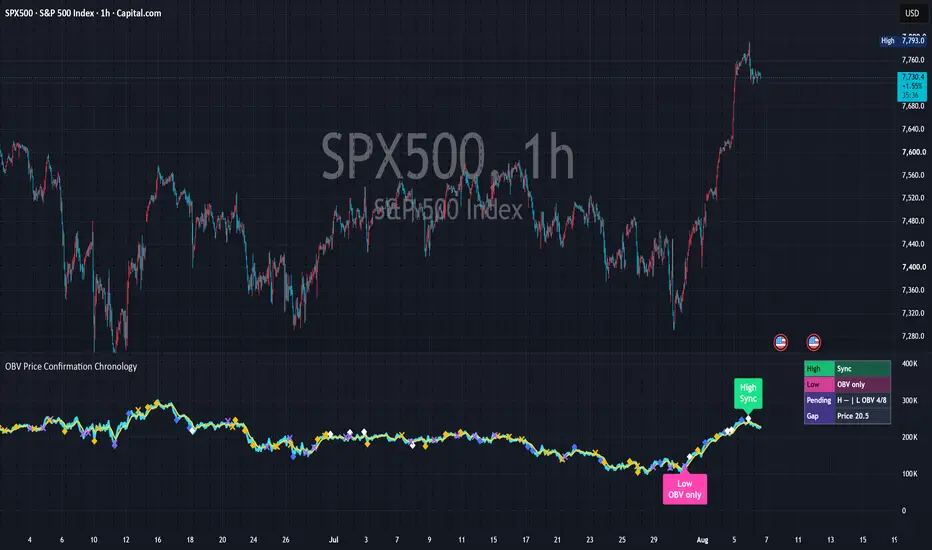
Real chart published on TradingView: OBV Price Confirmation Chronology - On Balance Volume
Real chart image from the published TradingView page. The symbol, timeframe, settings and prices shown are a captured example, not current data or a trading result.
PurposeCompare the timing of price and OBV records
Best forResearchers checking whether volume led, followed or failed to match a price record
Primary outputOBV, chronology markers, latest labels and status table
Chart placementSeparate pane
01 — Overview

Pair price and OBV records in chronological order

The indicator detects rolling high-side and low-side records independently in price and classical cumulative OBV, then pairs corresponding records oldest-first inside a configurable chart-bar tolerance. It is not classic pivot divergence and does not search for regular or hidden divergence.

What it visualizes

A cyan OBV line, yellow smoothing line, diamonds for completed pairs, X markers for expired unmatched records, a green latest high-side label, a pink latest low-side label, plus a table for chronology, range-position context and operating state.

How it works

Price records use High/Low or Close while OBV records always use classical cumulative OBV. Separate high-side and low-side queues pair matching price and OBV events oldest-first within the tolerance. Optional rolling zero-base and directional-balance displays never change the chronology basis.

High and low sides are independent

High-side compares new price highs with new OBV highs; low-side compares new price lows with new OBV lows. High and Low are record directions, not Long and Short recommendations.

Five chronology classes

Events are OBV led, Price led, Synchronized, Price only or OBV only. +N is chart-bar separation only, not strength, price distance, return or probability.

Compress or sample repeated records

The default sequence-start mode compresses consecutive records into the first event. Sampled mode keeps records at a configurable spacing for denser research.

02 — Install and start

Add it to TradingView

Add the public script to a standard candlestick chart. With defaults, identify the classical OBV line, smoothing line, diamonds, X markers, latest high/low labels and status table one at a time in the separate pane.

OBV Price Confirmation Chronology – On Balance Volume

Open the public OBV Price Confirmation Chronology – On Balance Volume page and add it to a TradingView chart. No SG Group account is required.

  1. Open the “Use on TradingView” link below.
  2. Select “Use on chart” on TradingView to add the script to your chart.
  3. Open the gear icon, then Settings → Inputs, and observe the default configuration first.
  4. Change one input at a time for the symbol and timeframe you are studying.
Observe the defaults firstChange one input at a timeVerify symbol, timeframe and feed

Prevent misreads when indicators overlap

Overlapping lines, bands, backgrounds or tables can be duplicate drawings of the same kind of information. Never treat visual overlap by itself as stronger evidence or signal agreement. Another OBV, volume oscillator, divergence marker, pane tint or corner table can overlap the OBV line, smoothing, diamonds, X markers, latest labels and table. Two coincident OBV lines do not create two independent volume confirmations.

  • Display this indicator alone first and identify the cyan OBV line and yellow smoothing line.
  • Toggle historical markers, high label, low label and status table one at a time to identify every diamond and X.
  • Put another OBV, volume or divergence study in a separate pane, or deliberately separate colors, widths and table positions.
  • If diamonds, X markers or labels overlap, isolate each indicator and do not count the overlap as multiple evidence.
03 — How to read it

A practical reading order

Keep high-side and low-side records separate, then read the price record, OBV record, order, pairing tolerance and any unmatched expiration. Do not reinterpret color or +N as strength, distance or direction.

Identify the record side

Confirm whether the marker or latest label belongs to the high-side or low-side chronology. Side is not a trade direction.

Read order and bar separation

Blue means OBV led, gold means Price led and white means Synchronized. +N reports bars between records, not confirmation strength or magnitude.

Separate unmatched events from range position

A gold X is Price only and a violet X is OBV only after tolerance expiry. The range-position gap separately normalizes price and OBV inside their own recent ranges.

Status and display terms

OBV led

The matching OBV record occurred before the price record and completed a pair inside tolerance.

Price led

The matching price record occurred before the OBV record and completed a pair inside tolerance.

Synchronized

Matching price and OBV records occurred on the same confirmed chart bar.

Price only

A price record expired without a matching OBV record inside tolerance.

OBV only

An OBV record expired without a matching price record inside tolerance.

+N

Chart-bar separation between paired records; not strength, magnitude, return or probability.

High / Low

High-side and low-side record families, not Long and Short recommendations.

04 — Settings reference

Settings reference

The labels below match the published script’s English Inputs panel. Defaults reflect the public source at the time of review and may change in a later TradingView update.

On small screens, each input is reformatted as a readable stacked card.

1. OBV Core

7 inputs
Input labelDefault / optionsWhat it controls and when to adjust it
Direction sourceCloseSelects the source whose bar-to-bar direction adds, subtracts or leaves volume unchanged in classical OBV.
Display modeClassic OBV / Rolling zero-base OBV / Directional balance % (default: Classic OBV)Chooses the visible series. Chronology events always use classical cumulative OBV, even when a display transform is selected.
Rolling zero-base length120 (2–3000; active for Rolling zero-base OBV)Sets the window used by Rolling zero-base OBV. It affects the visual transform only.
Directional balance length55 (2–1000; active for Directional balance %)Sets the window used by Directional balance %. It affects the visual transform only.
Show smoothing lineOnShows or hides the smoothing line over the displayed OBV series.
Smoothing typeEMA / SMA / RMA / WMA (default: EMA)Chooses EMA, SMA, RMA or WMA for the optional smoothing line.
Smoothing length9 (1–500)Sets the smoothing length. Shorter values react faster; longer values are smoother.

2. Record Chronology

9 inputs
Input labelDefault / optionsWhat it controls and when to adjust it
Price record sourceHigh / Low / Close (default: High / Low)Chooses High/Low records or close-only records for both sides.
Record event modeBreakout sequence start / Sampled rolling records (default: Breakout sequence start)Chooses sequence-start compression or more frequent sampled rolling-record events.
Record lookback34 (2–1000)Sets the rolling lookback used to define new price and OBV records.
Sequence reset bars3 (1–50; sequence-start mode only)Allows a new sequence-start event after this many bars without the same record type.
Minimum bars between sampled events5 (1–100; sampled mode only)Sets the minimum spacing between sampled events in Sampled rolling records mode.
Pair tolerance bars8 (0–100)Sets the maximum chart-bar separation allowed when pairing matching price and OBV records.
Minimum price record extension (ticks)1 (0–100)Requires a price record to extend the prior record by at least this many minimum ticks.
Evaluate confirmed bars onlyOnRestricts persistent chronology changes to closed bars. Off enables provisional intrabar preview while alerts still wait for bar close.
Pause event logic on non-standard chartsOnPauses chronology events on synthetic or non-standard chart types such as Heikin Ashi, Renko and Range.

3. Display

14 inputs
Input labelDefault / optionsWhat it controls and when to adjust it
Show historical event markersOnShows completed pairs as small diamonds and expired unmatched events as small X markers.
Show latest high-side labelOnShows the latest high-side chronology label above the OBV line.
Show latest low-side labelOnShows the latest low-side chronology label below the OBV line.
Latest label text styleCompact / Detailed (default: Compact)Chooses compact or detailed text for the latest event labels.
Latest label sizeTiny / Small / Normal / Large (default: Normal)Sets the latest-label text size.
Show status tableOnShows the chronology and range-position status table.
Status table positionTop Right / Bottom Right / Top Left / Bottom Left (default: Top Right)Chooses the table corner. Move it when another indicator occupies the same area.
Status table densityCompact / Detailed (default: Compact)Chooses the default four-row compact table or the longer detailed research readout.
Status table text sizeTiny / Small / Normal (default: Small)Sets status-table text size.
Bold status table textOnUses bold table text for readability without changing the calculation.
Show legend row in detailed tableOff (detailed table only)Adds a legend row only when Detailed table density is active.
Status table transparency10 (0–100)Sets table transparency; higher values make the background more transparent.
OBV line width3 (1–6)Sets the visible OBV line width.
Smoothing line width2 (1–6)Sets the optional smoothing-line width.

4. Context

3 inputs
Input labelDefault / optionsWhat it controls and when to adjust it
Range-position lookback55 (5–1000)Sets the separate recent ranges used to compare price position with OBV position.
Range-position gap threshold18.0 (0–100; step 0.1)Sets the materiality threshold for the difference between OBV and price positions inside their own recent ranges.
Show subtle gap tintOffAdds a subtle pane tint when the range-position gap is materially large.

5. Colors

12 inputs
Input labelDefault / optionsWhat it controls and when to adjust it
OBV lineCyan (#2AE0FF)Sets the displayed OBV line color.
Smoothing lineYellow (#FFD33B)Sets the smoothing-line color.
High-side latest labelGreen (#19E385)Sets the latest high-side label color.
Low-side latest labelPink (#FF43B0)Sets the latest low-side label color.
OBV-led markerBlue (#4673FF)Sets the marker color for completed OBV-led pairs.
Price-led markerGold (#FFBB00)Sets the marker color for completed price-led pairs.
Synchronized markerWhite (#FFFFFF)Sets the marker color for synchronized pairs.
Unpaired price markerGold (#FFBB00)Sets the X-marker color for an expired unmatched price record.
Unpaired OBV markerViolet (#A460FF)Sets the X-marker color for an expired unmatched OBV record.
Status table headerPurple (#7651FF)Sets the status-table header color.
Status table bodyDark slate (#293145)Sets the status-table body color.
Status table borderSlate (#8994B1)Sets the status-table border color.

6. Alerts

7 inputs
Input labelDefault / optionsWhat it controls and when to adjust it
Alert: high-side OBV ledOnEnables the alert condition for a completed high-side OBV-led pair.
Alert: high-side price ledOnEnables the alert condition for a completed high-side price-led pair.
Alert: high-side synchronizedOnEnables the alert condition for a synchronized high-side pair.
Alert: low-side OBV ledOnEnables the alert condition for a completed low-side OBV-led pair.
Alert: low-side price ledOnEnables the alert condition for a completed low-side price-led pair.
Alert: low-side synchronizedOnEnables the alert condition for a synchronized low-side pair.
Alert: unpaired expirationsOffEnables alerts for expired unmatched price or OBV events; disabled by default.
05 — Alerts

Alerts report completed chronology events

Alerts report confirmed high-side or low-side OBV-led, price-led, synchronized or unmatched-expiration events. They are not forecasts or trade instructions and must be created in TradingView.

  • High-side and low-side OBV-led alerts report that the OBV record occurred first and the price record later completed the pair.
  • High-side and low-side price-led alerts report that the price record occurred first and the OBV record later completed the pair.
  • High-side and low-side synchronized alerts report that matching price and OBV records occurred on the same confirmed bar.
  • Unpaired expiration reports that a price or OBV record did not receive its counterpart inside the tolerance; disabled by default.
06 — Limitations and responsible use

Not a buy/sell signal

This tool is for analysis and visualization. It is not investment advice, a trade recommendation, a forecast, or a promise of profit or accuracy. Results depend on inputs, symbol, timeframe, and data feed. You remain responsible for every trading decision.

Depends on usable volume

OBV events require usable positive volume. FX and CFD feeds may provide tick volume, which is not aggressor-side order flow or an order book.

Results depend on chronology settings

Lookback, event mode, event spacing and pairing tolerance change the event set and pairings. Do not treat multiple configurations as independent confirmations.

Provisional and synthetic-chart limits

Disabling confirmed-bar evaluation allows intrabar visuals to change before close. Synthetic charts alter the meaning of price records, so event logic is paused by default.

Not divergence or a trading system

The study does not use pivots, detect regular or hidden divergence, or provide entries, exits, targets, stops, position size, probability or performance.

Important

Price records, OBV records, chronology class, unmatched events and range-position gap are related descriptions from the same price-volume series. Do not count them as independent signals or convert High/Low, colors, +N or tint into trade direction or probability.

07 — FAQ

Frequently asked questions

Clarify display transforms, bar separation, unmatched records and the distinction from classic divergence.

Is OBV Price Confirmation Chronology – On Balance Volume free to use?

Yes. It is a free, open-source indicator published by SG Group on TradingView. Review TradingView’s terms and the conditions attached to the public script before reuse or redistribution.

Should I change the settings immediately?

Start with the published defaults and observe the drawings and state changes first. Then change one input at a time for the symbol, timeframe and data feed so you can identify what caused each visual change.

Can I display it with other indicators?

Yes, but similar lines, bands, backgrounds and tables can overlap and obscure their source. Isolate each indicator first and hide duplicate components. Visual overlap alone is not stronger evidence or signal agreement.

Does the display provide trade signals?

No. It is analysis and visualization context consistent with the public description. It does not provide entries, exits, targets, stops, price forecasts, or promises of profit, win rate or accuracy.

Does it detect classic OBV divergence?

No. It does not use confirmed pivots or regular/hidden divergence. It compares the timing of rolling price and classical-OBV records.

Source basis and update policy

This guide is grounded in SG Group’s live catalogue, the script’s published TradingView description, and the user-facing inputs in its open source. Labels and defaults can change after a script update.