PDH PDL PWH PWL Boundary Response Register Guide | SG Group
Skip to content
Japanese page

FreeOpen sourcePine Script v6

TradingView Free Indicator

Plot PDH, PDL, PWH and PWL from completed prior-day and prior-week data, then register how the current day or week interacts with each boundary. Examine Untested, Contacted, Sustained beyond and Re-entered states, post-contact residency/excursions, and daily-weekly range geometry in one chart register.

Prior Day/Week Boundaries
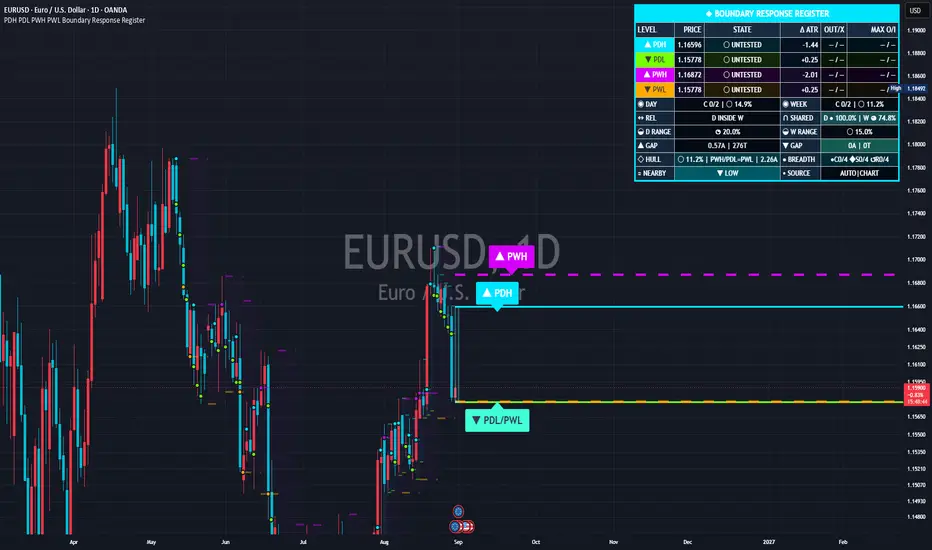
Real chart published on TradingView: PDH PDL PWH PWL Boundary Response Register
Real chart image from the published TradingView page. The symbol, timeframe, settings and prices shown are a captured example, not current data or a trading result.
PurposeDescribe completed prior-period boundaries and current-period response
Best forUsers examining nearby prior-day/week extremes and confirmed post-contact behavior
Primary outputPDH/PDL/PWH/PWL, four-stage lifecycle, response measurements, range geometry and register
Chart placementPrice-chart overlay
01 — Overview

Separate the fixed boundary from the response observed afterward

PDH and PDL are the raw high and low of the completed previous day; PWH and PWL are the raw high and low of the completed previous week. The script does not calculate a pivot ladder, classify support/resistance, predict direction, choose a target or produce entries and exits. It records confirmed interaction with each boundary.

What it visualizes

Four color-coded boundary lines, prior-day/week ribbons, their shared corridor, nearby high/low pair highlighting, retained historical segments, first-contact or full-lifecycle marks, collision-managed right-edge tags and a Boundary Response Register containing price, state, distance, response and range-geometry context.

How it works

Completed higher-timeframe values are requested with a one-period offset, so each active boundary stays fixed during its corresponding day or week. Contact can use wick range, candle body or confirmed close-to-close span plus optional tolerance. Consecutive confirmed closes beyond a boundary create Sustained beyond; a later confirmed return into the prior range creates Re-entered.

The four boundaries are raw completed-period prices

PDH, PDL, PWH and PWL are not pivot-formula, midpoint or equilibrium levels. A daily and weekly boundary at similar prices remain related references from the same market series, not independent confirmations.

Lifecycle states are facts, not forecasts

Untested means no confirmed contact; Contacted records the first one; Sustained beyond requires consecutive confirmed closes outside; Re-entered records a later confirmed return into the corresponding prior range. None predicts what follows.

Keep response and geometry separate

OUT/X reports outside-close residency and close-side recrosses; MAX O/I reports maximum outside and inside excursions. Shared corridor, nearby pairs and hull position describe price geometry, not probability, win rate or strength.

02 — Install and start

Add it to TradingView

Add the public script to a time-based intraday chart or the 1D chart. Under the defaults, identify PDH, PDL, PWH, PWL, the day/week ribbons, right-edge labels and Boundary Response Register before changing one input at a time.

PDH PDL PWH PWL Boundary Response Register

Open the public PDH PDL PWH PWL Boundary Response Register page and add it to a TradingView chart. It uses completed daily and weekly data for boundaries and commits lifecycle events on confirmed chart bars. No SG Group account is required.

  1. Open the “Use on TradingView” link below.
  2. Select “Use on chart” on TradingView to add the script to your chart.
  3. Open the gear icon, then Settings → Inputs, and observe the default configuration first.
  4. Change one input at a time for the symbol and timeframe you are studying.
Observe the defaults firstChange one input at a timeVerify symbol, timeframe and feed

Prevent misreads when indicators overlap

Overlapping lines, bands, backgrounds or tables can be duplicate drawings of the same kind of information. Never treat visual overlap by itself as stronger evidence or signal agreement. Another previous-day/week high-low study, session extremes, pivots, opening ranges, support/resistance lines, horizontal drawings or alerts can duplicate PDH, PDL, PWH, PWL, historical segments, ribbons, event marks, right-edge tags and the register. Merged or displaced tags do not change exact boundary prices.

  • Hide every other prior-day/week, session-high/low, pivot and horizontal-level study while identifying the four boundaries and their colors.
  • Toggle previous-day and previous-week boundaries separately to distinguish daily from weekly sources.
  • Toggle range ribbons, shared corridor, nearby-pair highlight and historical event marks one at a time to identify every fill and marker.
  • When tags merge or move for collision avoidance, use the horizontal lines and register for exact prices. Move other fixed tables to another chart corner.
03 — How to read it

A practical reading order

Do not begin by labelling a horizontal boundary as support, resistance or a target. Verify data source, boundary price, contact definition, four-stage lifecycle, post-contact measurements and cross-horizon geometry in that order.

Verify data source and source period

PDH/PDL remain previous-day values throughout the current day; PWH/PWL remain previous-week values throughout the current week. Check whether Reference data uses standard candles or the modified chart context.

Read lifecycle together with its definition

Do not read Untested, Contacted, Sustained beyond or Re-entered without checking wick/body/close-span contact, tolerance and required closes. Different definitions can classify the same chart differently.

Do not convert response or geometry into performance

Residency, recrosses, excursions, contact separation and range overlap describe the active source period. They are not historical probabilities, win rates, expectancy, entries or targets.

Status and display terms

PDH / PDL

High / low of the completed previous day; fixed during the active current day.

PWH / PWL

High / low of the completed previous week; fixed during the active current week.

Untested / Contacted

No confirmed contact under the selected definition / first confirmed contact recorded.

Sustained beyond / Re-entered

Required confirmed closes stayed outside / a later confirmed close returned into the prior range; neither is predictive.

OUT / X

Outside-close residency percentage / confirmed close-side recross count after first contact.

MAX O / I

Maximum outside excursion / maximum return into the prior range, normalized by frozen daily ATR.

NEARBY / SHARED

Day/week high or low pair is within tolerance / prior ranges share a mathematical intersection; not support/resistance.

04 — Settings reference

Settings reference

The labels below match the published script’s English Inputs panel. Defaults reflect the public source at the time of review and may change in a later TradingView update.

On small screens, each input is reformatted as a readable stacked card.

1. Reference Data and History

8 inputs
Input labelDefault / optionsWhat it controls and when to adjust it
Reference dataAutomatic / options: Automatic, Chart context, Standard candlesAutomatic uses the chart context on standard charts and standard-candle data on non-standard charts. Chart context preserves chart modifiers. Standard candles removes non-standard chart calculations and other ticker modifiers.
Show previous-day high and lowOnShows, hides or enables show previous-day high and low. Start with the published default and change one input at a time.
Show previous-week high and lowOnShows, hides or enables show previous-week high and low. Start with the published default and change one input at a time.
Keep completed period segmentsOnKeeps prior daily and weekly line segments on the chart for historical study. Disable this to retain only the active day and week.
Daily periods kept30 / min 1, max 120Controls daily periods kept. Start with the published default and change one input at a time.
Weekly periods kept16 / min 1, max 52Controls weekly periods kept. Start with the published default and change one input at a time.
Daily ATR length14 / min 1, max 100Uses the last completed daily ATR value for normalized distances and optional tolerance calculations.
Allow lifecycle events on non-standard chartsOffLevels remain available on non-standard charts. Lifecycle events, current-range progress, and related alerts are paused by default because synthetic bar construction can make event timing ambiguous. Enable only for explicit research use.

2. Boundary Response Lifecycle

6 inputs
Input labelDefault / optionsWhat it controls and when to adjust it
Contact definitionWick range / options: Wick range, Candle body, Close-to-close spanWick range checks the confirmed bar's high-low span. Candle body checks the open-close span. Close-to-close span checks whether consecutive confirmed closes straddle the level, including a gap when the two closes lie on opposite sides.
Contact toleranceExact / options: Exact, Ticks, Daily ATRControls contact tolerance. Start with the published default and change one input at a time.
Tolerance in ticks0 / min 0, max 1000Controls tolerance in ticks. Start with the published default and change one input at a time.
Tolerance as daily ATR0.02 / min 0, max 1, step 0.010.02 means 2% of the last completed daily ATR.
Closes required beyond2 / min 1, max 10A level enters Sustained beyond only after this many consecutive confirmed closes beyond it. This state is independent of direct wick/body contact, so a gap can qualify. It is descriptive, not a trade signal.
Reflect lifecycle in line styleOnUntested levels use their selected base style. Contacted levels become dashed, Sustained beyond levels become emphasized, and Re-entered levels become dotted.

3. Post-Contact Response Measurements

2 inputs
Input labelDefault / optionsWhat it controls and when to adjust it
Track post-contact responseOnAfter a boundary's first confirmed contact, records outside-close residency, close-side recrosses, maximum outside excursion, maximum return into the prior range, the first-contact form, and lifecycle timing. These are descriptive measurements, not trade signals.
Excursion measurementWicks / options: Wicks, ClosesWicks uses confirmed bar highs/lows for maximum excursions. Closes uses confirmed closing prices. Outside-close residency always uses confirmed closes.

4. Cross-Horizon Range Geometry

11 inputs
Input labelDefault / optionsWhat it controls and when to adjust it
Highlight nearby day-week pairsOnHighlights PDH near PWH and PDL near PWL. It does not classify a cluster as support or resistance.
Cluster thresholdDaily ATR / options: Daily ATR, Ticks, PercentControls cluster threshold. Start with the published default and change one input at a time.
Threshold as daily ATR0.12 / min 0, max 2, step 0.010.12 means the two levels are treated as nearby when their separation is no more than 12% of the last completed daily ATR.
Threshold in ticks25 / min 0, max 100000Controls threshold in ticks. Start with the published default and change one input at a time.
Threshold in percent0.1 / min 0, max 10, step 0.010.10 means 0.10% of the two compared levels' mean absolute price.
High-pair highlightrgba(255,235,59,1)Sets the display color for high-pair highlight. It changes presentation only, not boundary prices or measurements.
Low-pair highlightrgba(64,255,218,1)Sets the display color for low-pair highlight. It changes presentation only, not boundary prices or measurements.
Highlight transparency91 / min 70, max 98Controls highlight transparency. Start with the published default and change one input at a time.
Show shared prior-range corridorOnHighlights only the price interval shared by the previous completed daily range and the previous completed weekly range. This is a geometric overlap reference, not a support/resistance classification.
Shared-corridor colorrgba(82,255,255,1)Sets the display color for shared-corridor color. It changes presentation only, not boundary prices or measurements.
Shared-corridor transparency95 / min 80, max 98Controls shared-corridor transparency. Start with the published default and change one input at a time.

5. Lines and Range Ribbons

17 inputs
Input labelDefault / optionsWhat it controls and when to adjust it
PDH colorrgba(0,229,255,1)Sets the display color for pdh color. It changes presentation only, not boundary prices or measurements.
PDL colorrgba(118,255,3,1)Sets the display color for pdl color. It changes presentation only, not boundary prices or measurements.
PWH colorrgba(213,0,249,1)Sets the display color for pwh color. It changes presentation only, not boundary prices or measurements.
PWL colorrgba(255,171,0,1)Sets the display color for pwl color. It changes presentation only, not boundary prices or measurements.
Daily line width3 / min 1, max 5Controls daily line width. Start with the published default and change one input at a time.
Weekly line width4 / min 1, max 5Controls weekly line width. Start with the published default and change one input at a time.
Add active-level contrast haloOnDraws a chart-background-colored outline beneath the four active levels. The outline stays on the symbol's main price scale and improves separation from candles, grids, and range shading.
Halo width addition2 / min 1, max 4Controls halo width addition. Start with the published default and change one input at a time.
Halo transparency12 / min 0, max 70Lower values create a stronger separation outline. The outline automatically follows the chart background color.
Dim completed period segmentsOnKeeps historical study context while making the four currently active levels visually dominant.
Completed-segment transparency58 / min 0, max 95Controls completed-segment transparency. Start with the published default and change one input at a time.
Completed-segment width reduction1 / min 0, max 4Controls completed-segment width reduction. Start with the published default and change one input at a time.
Daily base line styleSolid / options: Solid, Dashed, DottedControls daily base line style. Start with the published default and change one input at a time.
Weekly base line styleDashed / options: Solid, Dashed, DottedControls weekly base line style. Start with the published default and change one input at a time.
Show prior-range ribbonsOnAdds very light ribbons between PDH-PDL and PWH-PWL. The ribbons are visual references only.
Daily ribbonrgba(0,188,212,0.04)Sets the display color for daily ribbon. It changes presentation only, not boundary prices or measurements.
Weekly ribbonrgba(156,39,176,0.03)Sets the display color for weekly ribbon. It changes presentation only, not boundary prices or measurements.

6. Labels and Event Marks

19 inputs
Input labelDefault / optionsWhat it controls and when to adjust it
Show right-edge level labelsOnShows, hides or enables show right-edge level labels. Start with the published default and change one input at a time.
Right-label contentCode only / options: Code + price, Code only, Code + lifecycleCode only is the compact default. Exact prices and lifecycle details remain available in the Boundary Response Register and label tooltips.
Right-label horizontal placementResponsive / options: Responsive, Fixed barsResponsive converts a percentage of the currently visible bar count into the future-bar offset, keeping a more consistent screen-space distance as horizontal zoom changes. Fixed bars uses only the minimum/fixed offset below.
Responsive offset as visible width (%)8 / min 2, max 25, step 0.5Approximate share of the visible bar count reserved between the latest bar and the annotation rail. The result is capped below Pine's 500-bar future-drawing limit and never falls below the minimum offset.
Stagger daily and weekly rail anchorsOnWhen enabled, weekly annotations use a second horizontal anchor lane. Responsive placement can enlarge the gutter as the visible bar count increases.
Merge nearby day/week labelsOnWhen PDH is within the configured proximity threshold of PWH, or PDL is near PWL, the two chart tags collapse into PDH/PWH or PDL/PWL. Exact prices, states, and separate horizontal levels remain unchanged and are preserved in the tooltip and register.
Minimum / fixed right-label offset12 / min 4, max 200Minimum future-bar distance used by Responsive placement, or the exact distance used by Fixed bars placement.
Daily-weekly rail stagger4 / min 1, max 20Minimum additional future bars between daily and weekly anchor points. Responsive placement can enlarge this gutter in proportion to the visible bar count.
Auto-separate close rail labelsOnResolves every active right-edge tag in one collision set, including merged pairs and cross-group labels. Exact boundary prices and horizontal lines remain unchanged. Optional leader segments identify displaced tags.
Minimum rail-label gap as daily ATR0.3 / min 0, max 2, step 0.05Minimum visual separation between nearby display tags, expressed as a fraction of the last completed daily ATR.
Minimum rail-label gap in ticks12 / min 0, max 10000Tick-based floor for automatic rail-label separation. The larger of this value and the ATR-based value is used.
Scale-aware rail-label spacingOnAdds a spacing floor derived from the highest and lowest visible chart bars. The script recalculates this floor when the visible window changes, so label separation adapts when the chart is scrolled or zoomed.
Minimum rail-label gap as visible range (%)6 / min 0, max 20, step 0.25Minimum display-anchor separation as a percentage of the visible bars' high-low range. The final gap is the largest of this value, the daily-ATR floor, and the tick floor.
Show displaced-label leadersOnDraws a short dotted segment between the exact boundary price and a display tag that was shifted vertically. Merged pair tags can receive one leader from each exact boundary.
Right-label sizeLarge / options: Tiny, Small, Normal, Large, HugeControls right-label size. Start with the published default and change one input at a time.
Historical event marksFirst contact / options: Off, First contact, Full lifecycleFirst contact marks only the first confirmed contact per level and period. Full lifecycle also marks the first Sustained beyond and first Re-entered event.
Event-mark contentSymbol only / options: Symbol only, Symbol + codeSymbol only is the cleaner default. Colors identify PDH, PDL, PWH, and PWL, while tooltips preserve the full event description.
Event marks kept90 / min 10, max 450Controls event marks kept. Start with the published default and change one input at a time.
Event-mark sizeNormal / options: Tiny, Small, NormalControls event-mark size. Start with the published default and change one input at a time.

7. Boundary Response Register

12 inputs
Input labelDefault / optionsWhat it controls and when to adjust it
Show boundary response registerOnShows, hides or enables show boundary response register. Start with the published default and change one input at a time.
Register positionTop right / options: Top right, Top left, Bottom right, Bottom leftControls register position. Start with the published default and change one input at a time.
Register sizeCompact / options: Compact, Balanced, Presentation, CustomCompact is the default and is designed to preserve chart space while keeping every visible cell bold and high contrast. Balanced adds moderate size. Presentation restores the large publication-oriented scale. Custom unlocks the three point-size inputs below.
Custom body text size (pt)13 / min 9, max 26Used only when Register size is Custom. All visible register text remains bold.
Custom column text size (pt)14 / min 10, max 28Controls custom column text size (pt). Start with the published default and change one input at a time.
Custom title text size (pt)16 / min 12, max 32Controls custom title text size (pt). Start with the published default and change one input at a time.
Register fontDefault / options: Default, MonospaceDefault uses the system's proportional chart font and generally appears heavier. Monospace remains available for fixed-width numerical alignment.
Register backgroundrgba(0,3,9,1)Sets the display color for register background. It changes presentation only, not boundary prices or measurements.
Register headerrgba(0,229,255,1)Sets the display color for register header. It changes presentation only, not boundary prices or measurements.
Primary textrgba(250,252,255,1)Sets the display color for primary text. It changes presentation only, not boundary prices or measurements.
Secondary textrgba(222,231,245,1)Sets the display color for secondary text. It changes presentation only, not boundary prices or measurements.
Register gridrgba(255,255,255,0.76)Sets the display color for register grid. It changes presentation only, not boundary prices or measurements.

8. Alerts

4 inputs
Input labelDefault / optionsWhat it controls and when to adjust it
Enable combined dynamic alert()OffWhen enabled, confirmed lifecycle, completed contact-pair, and response-threshold events on the same bar are combined into one alert() message. Create the TradingView alert using Any alert() function call.
Minimum response observations4 / min 1, max 100Minimum confirmed post-contact observations required before an outside-close residency threshold can trigger.
Outside-close residency threshold (%)75 / min 0, max 100, step 1Triggers once per boundary and source period when the outside-close share reaches this threshold after the minimum observation count.
Outside-excursion threshold (ATR)0.5 / min 0, max 20, step 0.05Triggers once per boundary and source period when maximum outside excursion reaches this many frozen daily ATR units.
05 — Alerts

Factual boundary-contact, sustained-beyond, re-entry and response-threshold alerts

Alerts report confirmed contact, sustained-beyond, re-entry, nearby day/week pairs, completed contact pairs and configured response thresholds. They do not instruct a trade or forecast continuation, reversal, target or stop.

  • First contact, Sustained beyond and Re-entered alerts are confirmed observations under the selected contact and close-count rules.
  • Nearby PDH/PWH, nearby PDL/PWL and completed daily/weekly contact-pair alerts report distance or pair completion, not support/resistance strength.
  • Outside-close residency and maximum outside-excursion thresholds are descriptive alerts after the minimum observations. Enable the combined dynamic call separately and create an Any alert() function call alert when required.
06 — Limitations and responsible use

Not a buy/sell signal

This tool is for analysis and visualization. It is not investment advice, a trade recommendation, a forecast, or a promise of profit or accuracy. Results depend on inputs, symbol, timeframe, and data feed. You remain responsible for every trading decision.

Fixed boundaries and developing context update differently

PDH, PDL, PWH, PWL and normalized ATR come from completed higher-timeframe periods and stay fixed during the active source period. Current distance, developing day/week range use and current-period extremes can change intrabar.

The 1D chart limits daily lifecycle accumulation

PDH/PDL lifecycle resets on every new daily bar. With more than one required close, multi-close Sustained beyond for daily boundaries is mainly meaningful on intraday charts. Weekly boundaries can still accumulate daily closes.

Finalized OHLC does not reconstruct intrabar order

One chart bar can contact several boundaries without proving tick order. Events confirmed on the same bar are simultaneous at chart resolution unless the available data proves otherwise.

Session, provider and chart type matter

Holidays, early closes, exchange or broker feeds and ticker modifiers can change completed-period OHLC. Lifecycle evaluation is paused by default on synthetic charts. Only time-based intraday and 1D charts are supported.

Important

Boundaries, nearby pairs, shared corridor, lifecycle, OUT/X, MAX O/I and hull position are related descriptions derived from the same price series and active periods. Do not count coincidence as independent evidence or relabel it as support, resistance, liquidity, reversal, continuation, entry, target, stop or probability.

07 — FAQ

Frequently asked questions

Clarify fixed boundary timing, four lifecycle states, post-contact response, the 1D limitation, non-standard charts and moving display labels.

Is PDH PDL PWH PWL Boundary Response Register free to use?

Yes. It is a free, open-source indicator published by SG Group on TradingView. Review TradingView’s terms and the conditions attached to the public script before reuse or redistribution.

Should I change the settings immediately?

Start with the published defaults and observe the drawings and state changes first. Then change one input at a time for the symbol, timeframe and data feed so you can identify what caused each visual change.

Can I display it with other indicators?

Yes, but similar lines, bands, backgrounds and tables can overlap and obscure their source. Isolate each indicator first and hide duplicate components. Visual overlap alone is not stronger evidence or signal agreement.

Does the display provide trade signals?

No. It is analysis and visualization context consistent with the public description. It does not provide entries, exits, targets, stops, price forecasts, or promises of profit, win rate or accuracy.

Do PDH, PDL, PWH and PWL repaint with each current bar?

The four boundaries use one-period-offset completed daily and weekly data, so they stay fixed during the corresponding current day or week. Current distance, developing range use and visual tag positions can still change with realtime price or viewport changes; those are not boundary-price revisions.

Source basis and update policy

This guide is grounded in SG Group’s live catalogue, the script’s published TradingView description, and the user-facing inputs in its open source. Labels and defaults can change after a script update.