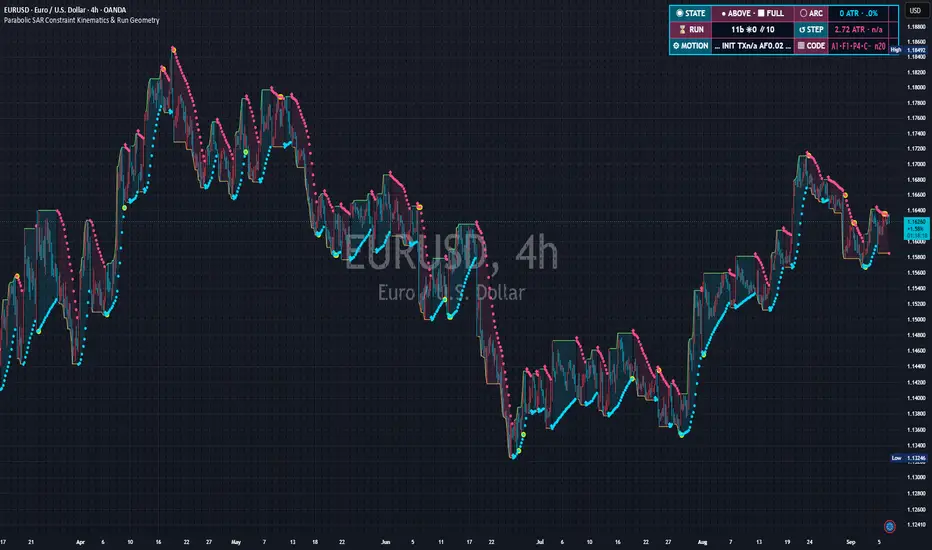
Show Parabolic SAR dots | On | Sets show parabolic sar dots. This is a display control; it does not alter the canonical SAR calculation. |
SAR dot width | 2 / min 1, max 5 | A width of 2 keeps the dots clear without obscuring candle structure. |
Show extreme-point trace | On | Plots the highest high while SAR is below price, or the lowest low while SAR is above price. |
Extreme-point trace width | 1 / min 1, max 4 | Sets extreme-point trace width. This is a display control; it does not alter the canonical SAR calculation. |
Fill the SAR-to-extreme-point arc | On | Fills the measured space between Parabolic SAR and the active run extreme point. |
Normal arc transparency | 90 / min 70, max 100 | Higher values make the normal arc fill less prominent. |
Tight-arc transparency | 78 / min 60, max 100 | The fill becomes slightly more visible while the active run is in a tight-arc state. |
Show current run origin line | Off | Draws one dotted line for the current fully observed run only. It is disabled by default because historical origin levels can resemble support or resistance. |
Show arc midline | Off | Sets show arc midline. This is a display control; it does not alter the canonical SAR calculation. |
Event marker presentation | Icons / options: Off, Icons, Text badges | Icons provide the cleanest chart. Text badges are intended for detailed inspection rather than publication thumbnails. |
Show PSAR side-change markers | On | Places a neutral marker at the PSAR point when SAR changes sides relative to price. |
Show tight / wide arc markers | Off | Disabled by default because fill intensity and the study panel already show the arc state. Enable these neutral markers for detailed inspection. |
Show age / AF / pause / brief markers | Off | Disabled by default to prevent label congestion. Enable for detailed run research. |
Show every new extreme point | Off | Useful for inspecting observed AF progression. Disabled by default for chart clarity. |
Marker spacing (range units) | 0.16 / min 0, max 2 | Offsets non-turn markers away from the extreme-point trace using the selected normalization range. |
Show completed-run summaries | Off | Detailed summaries are disabled by default because they can obscure price. Old summaries are automatically deleted at the selected limit. |
Maximum completed-run summaries | 12 / min 1, max 60 | Sets maximum completed-run summaries. This is a display control; it does not alter the canonical SAR calculation. |
Maximum descriptive event markers | 60 / min 20, max 180 | Caps historical markers to preserve readability and remain comfortably below the label-object limit. |
Tint bars by current PSAR side | Off | Optional contextual coloring only. Disabled by default. |
Shade active tight-arc state | Off | Optional background emphasis only. Disabled by default. |