

What it visualizes
Tenkan, Kijun, optional Chikou, projected cloud edges and fill, percentile-driven opacity, a dense inner core, expansion spine, three-line readout and confirmed future-twist and thin-seam events.
FreeOpen sourcePine Script v6
Normalize the distance between Senkou Span A and B by ATR, percentage or raw price, then visualize its historical rank and expansion or contraction. Read future-cloud direction, thickness and motion as separate facts.
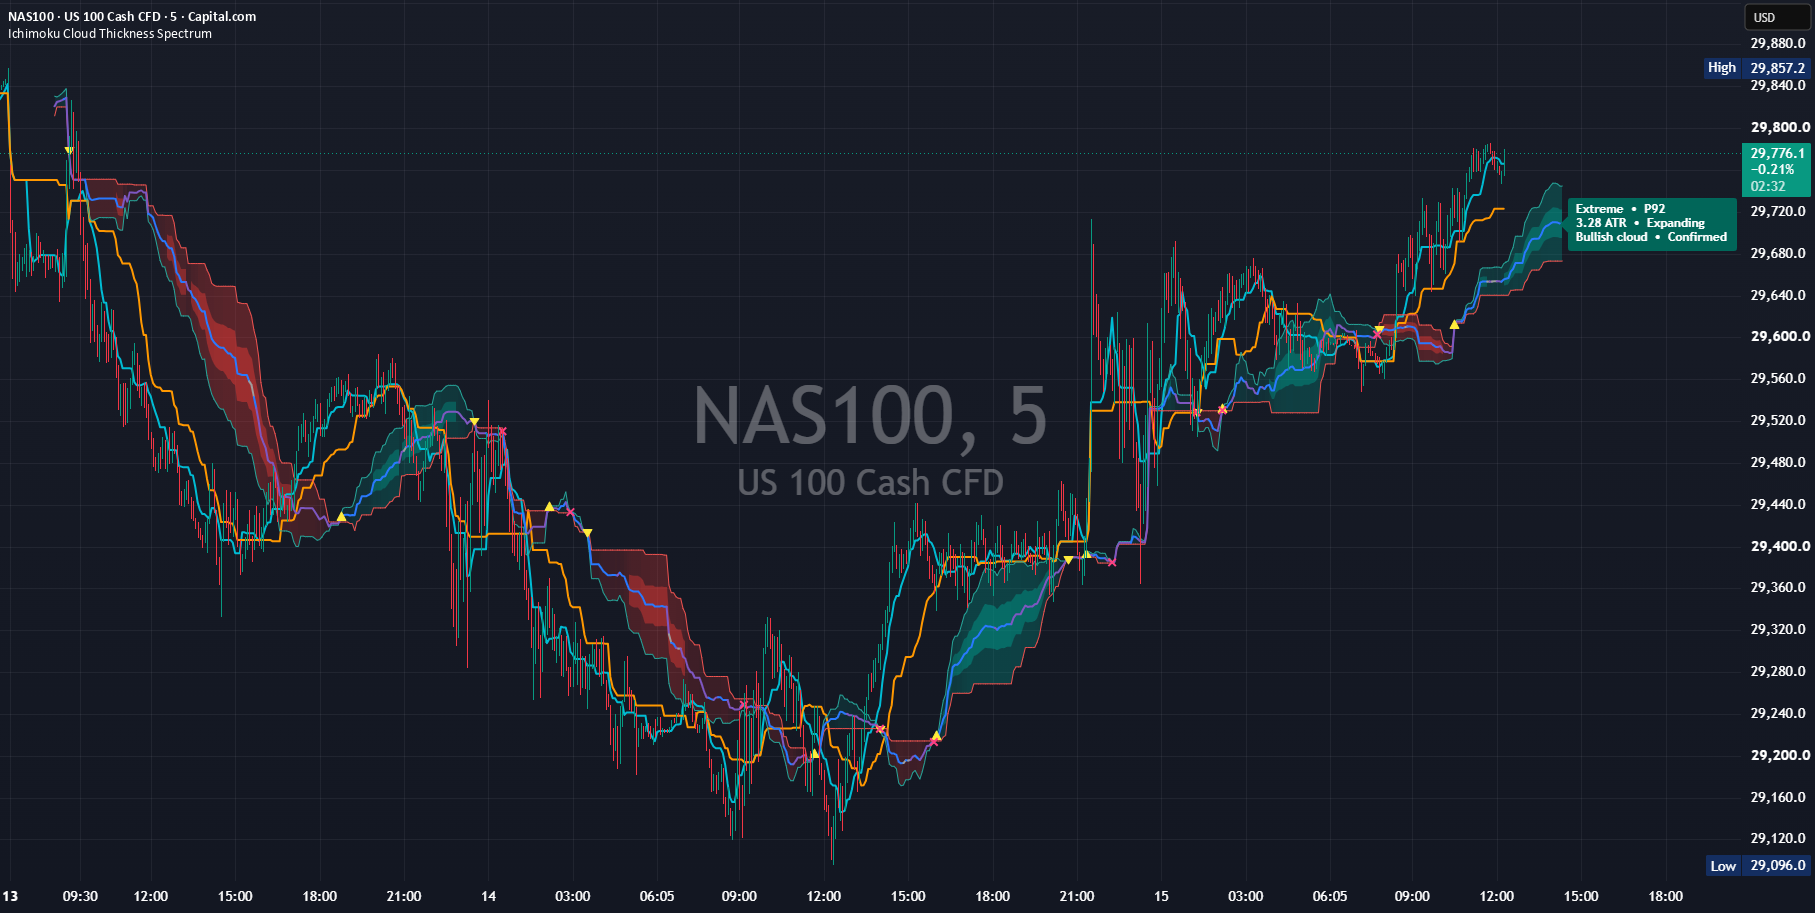
Classical Tenkan, Kijun and Senkou Span A/B form the cloud. Absolute A–B width is normalized, ranked inside its own history and smoothed for Expanding, Contracting or Stable motion with hysteresis. The current interface is English-only and has no Language input.
Tenkan, Kijun, optional Chikou, projected cloud edges and fill, percentile-driven opacity, a dense inner core, expansion spine, three-line readout and confirmed future-twist and thin-seam events.
New spans are plotted forward by Displacement without accessing future data. Price-versus-cloud tests use historically shifted spans aligned to the current bar. Thin seams require right-side pivot confirmation, so delay is intentional.
ATR, Percent or Raw normalized thickness is ranked inside Percentile lookback and classified from Thin to Extreme.
Thickness change enters Expanding or Contracting beyond sensitivity and returns to Stable at a smaller release threshold.
Future-cloud twists and filtered thin seams use confirmed-bar logic. Allow before confirmation only changes marker placement after confirmation.
Add the public script to a chart and identify every drawing in the default configuration first. Change only one input at a time.
Open the public Ichimoku Cloud Thickness Spectrum page and add it to a TradingView chart. No SG Group account is required.
Overlapping lines, bands, backgrounds or tables can be duplicate drawings of the same kind of information. Never treat visual overlap by itself as stronger evidence or signal agreement. TradingView built-in Ichimoku or another cloud study can duplicate Tenkan, Kijun, Span A/B and the cloud almost exactly. Remove that duplication before any interpretation.
Do not turn one value or color into a conclusion. Check the condition, persistence and relationship to price in order.
Bullish/Bearish cloud is the Span A/B ordering, not a trade direction.
P-values are relative to this symbol, timeframe, configuration and history—not a cross-market strength score.
Separate Expanding/Contracting/Stable from Live/Confirmed and do not treat an open-bar update as a confirmed event.
Historical rank of current cloud width, not universal strength.
Smoothed one-bar thickness motion with hysteresis.
Projected Span A is above/equal to / below Span B; not a trade instruction.
Percentile inside the same configured history, not a cross-market score.
The readout is on an open realtime bar / a confirmed bar.
A locally thin point confirmed by pivot, prominence and spacing rules; confirmation is delayed.
The labels below match the published script’s English Inputs panel. Defaults reflect the public source at the time of review and may change in a later TradingView update.
On small screens, each input is reformatted as a readable stacked card.
| Input label | Default / options | What it controls and when to adjust it |
|---|---|---|
Use confirmed values in readout | true | Uses the previous closed bar in the readout only while the latest realtime bar is open. |
| Input label | Default / options | What it controls and when to adjust it |
|---|---|---|
Conversion length (Tenkan) | 9 | range: 1–500 | Midrange length for Tenkan-sen. |
Base length (Kijun) | 26 | range: 1–500 | Midrange length for Kijun-sen. |
Leading Span B length | 52 | range: 1–1000 | Midrange length for Senkou Span B. |
Displacement | 26 | range: 1–100 | Base displacement used to plot the projected cloud. |
Offset alignment | TradingView-compatible | options: TradingView-compatible, Exact bar count | Uses Displacement minus one for TradingView-compatible alignment or the exact entered count. |
Show Tenkan | true | Shows Tenkan-sen. |
Show Kijun | true | Shows Kijun-sen. |
Show Chikou | false | Shows Chikou Span. |
Tenkan width | 2 | range: 1–4 | Tenkan line width. |
Kijun width | 2 | range: 1–4 | Kijun line width. |
Chikou width | 1 | range: 1–4 | Chikou line width. |
Cloud edge width | 1 | range: 1–4 | Senkou Span A/B edge width. |
| Input label | Default / options | What it controls and when to adjust it |
|---|---|---|
Thickness basis | ATR | options: ATR, Percent, Raw | Selects ATR-normalized, percent, or raw-price cloud thickness. |
ATR length | 26 | range: 1–500 | ATR length used when Thickness basis is ATR. |
Percentile lookback | 252 | range: 20–2000 | Lookback for the rolling thickness percentile. |
Expansion smoothing | 5 | range: 1–100 | EMA smoothing length for thickness motion. |
Expansion sensitivity (%) | 0.35 | range: 0–25 | step: 0.05 | Stabilized one-bar percent change required to enter expansion or contraction. |
Motion release ratio (%) | 55.0 | range: 0–100 | step: 5 | Release threshold as a percentage of the main motion sensitivity. |
Near-zero motion floor (%) | 5.0 | range: 0.1–50 | step: 0.5 | Denominator floor that stabilizes motion near zero thickness. |
Thin threshold percentile | 20.0 | range: 1–49 | step: 1 | Maximum percentile classified as Thin. |
Thick threshold percentile | 70.0 | range: 51–95 | step: 1 | Minimum percentile classified as Thick. |
Extreme threshold percentile | 90.0 | range: 60–100 | step: 1 | Minimum percentile classified as Extreme. |
| Input label | Default / options | What it controls and when to adjust it |
|---|---|---|
Show cloud | true | Shows the projected cloud fill. |
Show Span A and B edges | true | Shows Senkou Span A and B edge lines. |
Show expansion spine | true | Shows the cloud-midpoint motion spine. |
Expansion spine width | 2 | range: 1–4 | Motion-spine line width. |
Show dense inner core | true | Shows a denser inner core for sufficiently high thickness rank. |
Core width (% of cloud) | 38.0 | range: 5–90 | step: 1 | Inner-core width as a percentage of cloud thickness. |
Core minimum percentile | 60.0 | range: 0–100 | step: 1 | Minimum thickness percentile required to show the core. |
Thin cloud transparency | 92 | range: 0–100 | Cloud transparency at the thin end of the rank scale. |
Thick cloud transparency | 67 | range: 0–100 | Cloud transparency at the thick end of the rank scale. |
Core opacity boost | 16 | range: 0–60 | Additional opacity applied to the dense core. |
Show forward thickness readout | true | Shows the three-line forward thickness readout. |
Readout text size | 12 | range: 8–24 | step: 1 | Forward-readout text size. |
Readout transparency | 4 | range: 0–100 | Forward-readout background transparency. |
Bold readout text | true | Uses bold text in the readout. |
Automatic text contrast | true | Automatically chooses readable light or dark readout text. |
Show Live/Confirmed tag | true | Shows whether the readout is live or confirmed. |
Readout horizontal shift (bars) | 0 | range: -25–50 | step: 1 | Moves only the readout horizontally without changing calculations. |
Highlight closes inside current cloud | false | Highlights bars whose close is inside the current aligned cloud. |
Inside-cloud bar transparency | 20 | range: 0–100 | Transparency of inside-cloud bar coloring. |
| Input label | Default / options | What it controls and when to adjust it |
|---|---|---|
Show future twist markers | true | Shows confirmed projected-cloud twist markers. |
Show confirmed thin seams | true | Shows confirmed filtered local thin-cloud seams. |
Thin-seam pivot bars | 3 | range: 1–20 | Left/right pivot bars used to confirm a thin seam. |
Minimum seam prominence | 5.0 | range: 0–50 | step: 0.5 | Required percentile rebound on both sides; zero disables the filter. |
Minimum seam spacing | 8 | range: 0–250 | Minimum bars between accepted seams; zero disables the filter. |
Allow seam placement before confirmation | false | After confirmation, permits placing the marker at the earlier projected pivot location. |
Enable dynamic alerts | true | Enables combined dynamic messages through Any alert() function call. |
| Input label | Default / options | What it controls and when to adjust it |
|---|---|---|
Tenkan color | #00BCD4 | Tenkan-sen color. |
Kijun color | #FF9800 | Kijun-sen color. |
Chikou color | #9C27B0 | Chikou Span color. |
Span A edge | #26A69A | Senkou Span A edge color. |
Span B edge | #EF5350 | Senkou Span B edge color. |
Bullish cloud | #009688 | Cloud color when Span A is at or above Span B. |
Bearish cloud | #E53935 | Cloud color when Span A is below Span B. |
Expanding spine | #2979FF | Spine color while thickness is expanding. |
Contracting spine | #7E57C2 | Spine color while thickness is contracting. |
Stable spine | #9E9E9E | Spine color while thickness motion is stable. |
Twist marker | #FFEB3B | Projected-cloud twist marker color. |
Thin-seam marker | #FF4081 | Confirmed thin-seam marker color. |
Inside-cloud bars | #FFC107 | Bar color for closes inside the current cloud. |
Bullish readout background | #00695C | Readout background for a bullish projected cloud. |
Bearish readout background | #B71C1C | Readout background for a bearish projected cloud. |
Manual readout text | #FFFFFF | Manual readout text color when automatic contrast is disabled. |
Alerts are state, touch or transition events defined in the public source. They are not trade instructions.
This tool is for analysis and visualization. It is not investment advice, a trade recommendation, a forecast, or a promise of profit or accuracy. Results depend on inputs, symbol, timeframe, and data feed. You remain responsible for every trading decision.
Thick or Extreme does not guarantee support, resistance or continuation. Thin does not forecast a breakout.
P-values are configuration-specific. Warm-up, non-time-based charts and sparse data affect stability.
Tenkan, Kijun, spans, opacity and motion can change until the realtime bar closes.
Do not count Bullish cloud, Thick and Expanding as three independent bullish reasons. They are related descriptions of the same cloud geometry.
Clarify thickness rank, motion, forward plotting, confirmation delay and the current English-only interface.
Yes. It is a free, open-source indicator published by SG Group on TradingView. Review TradingView’s terms and the conditions attached to the public script before reuse or redistribution.
Start with the published defaults and observe the drawings and state changes first. Then change one input at a time for the symbol, timeframe and data feed so you can identify what caused each visual change.
Yes, but similar lines, bands, backgrounds and tables can overlap and obscure their source. Isolate each indicator first and hide duplicate components. Visual overlap alone is not stronger evidence or signal agreement.
No. It is analysis and visualization context consistent with the public description. It does not provide entries, exits, targets, stops, price forecasts, or promises of profit, win rate or accuracy.
No. Spans calculated from available bars are displayed at a future offset. Price-versus-cloud checks use historically calculated spans aligned to the current bar.
This guide is grounded in SG Group’s live catalogue, the script’s published TradingView description, and the user-facing inputs in its open source. Labels and defaults can change after a script update.