MACD Momentum Phase Observatory Guide | SG Group
Skip to content
Japanese page

FreeOpen sourcePine Script v6

TradingView Free Indicator

Keep the familiar MACD line, Signal line and Histogram while organizing Histogram sign and expansion, contraction or equilibrium into five descriptive phases. Add rolling relative magnitude, reactivation after subdued conditions, cross-cycle peak retention and MACD path efficiency in one research pane.

Momentum / Oscillator
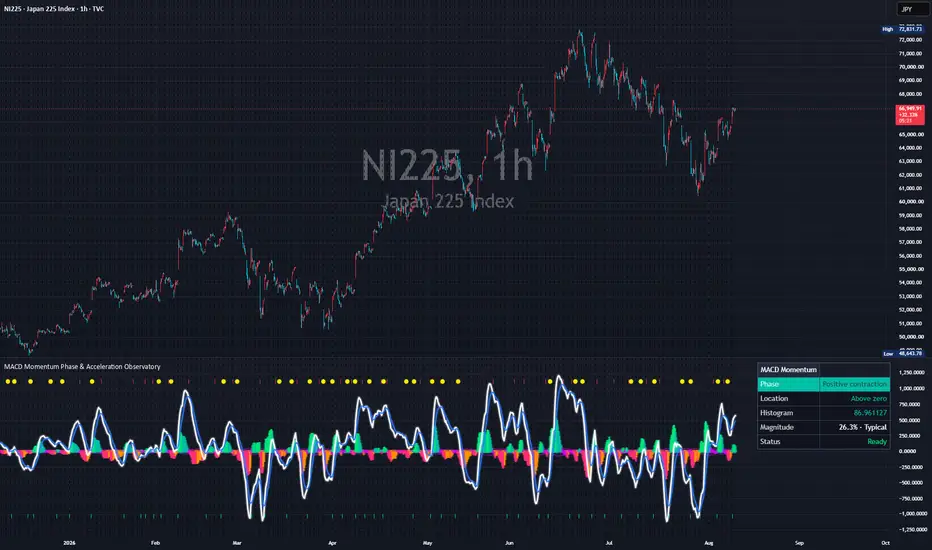
Real chart published on TradingView: MACD Momentum Phase & Acceleration Observatory
Real chart image from the published TradingView page. The symbol, timeframe, settings and prices shown are a captured example, not current data or a trading result.
PurposeOrganize how MACD momentum changes
Best forUsers studying expansion, contraction, equilibrium and persistence beyond a simple crossover
Primary outputMACD, Signal, five-state Histogram and context readout
Chart placementSeparate pane
01 — Overview

Read a MACD cross as a momentum lifecycle

A current-chart momentum research indicator built from raw MACD, its smoothed Signal and their Histogram. Noise-aware magnitude change and an adaptive equilibrium boundary classify Positive Expansion, Positive Contraction, Negative Expansion, Negative Contraction and Near Equilibrium. It does not select trades, forecast price, estimate win rate or manage risk.

What it visualizes

MACD and Signal lines, a state-colored Histogram, adaptive equilibrium band, phase-colored zero rail, optional background tint, line-separation fill, event markers, and Compact or Detailed readout. Detailed mode adds acceleration, phase age, cross-cycle age and peak retention, path efficiency and confirmed/live bar state.

How it works

Crosses, zero events, phases, magnitude, efficiency and cycle retention are calculated from raw MACD. Display can remain in native units or normalize all three components by one percent of the slow average or ATR without rewriting analytical history. A noise deadband and separate equilibrium entry/exit boundaries reduce small-change and boundary flapping.

Classify a five-state phase

Histogram sign combines with noise-filtered absolute-magnitude expansion or contraction. Values inside the adaptive boundary become Near Equilibrium. Colors describe calculation state, not trade direction.

Rank magnitude against recent history

Absolute Histogram receives a 0–100 Percent Rank, Range Rank or default 65/35 Hybrid Rank, then Subdued, Typical and Extended labels. These are not probabilities, confidence or overbought/oversold calls.

Measure cycle retention and path efficiency

Retention compares current absolute Histogram with the largest value since the latest MACD/Signal cross. Efficiency divides net MACD displacement by total travel to describe a direct or rotational path.

02 — Install and start

Add it to TradingView

Add the public script to a separate pane, then identify the MACD line, Signal line, Histogram, zero guide, yellow dots and readout under the defaults. Change one analytical or display input at a time.

MACD Momentum Phase & Acceleration Observatory

Open the public MACD Momentum Phase & Acceleration Observatory page and add it to a TradingView chart. No SG Group account is required.

  1. Open the “Use on TradingView” link below.
  2. Select “Use on chart” on TradingView to add the script to your chart.
  3. Open the gear icon, then Settings → Inputs, and observe the default configuration first.
  4. Change one input at a time for the symbol and timeframe you are studying.
Observe the defaults firstChange one input at a timeVerify symbol, timeframe and feed

Prevent misreads when indicators overlap

Overlapping lines, bands, backgrounds or tables can be duplicate drawings of the same kind of information. Never treat visual overlap by itself as stronger evidence or signal agreement. A standard MACD, derivative MACD, Histogram, crossover arrows, zero guide, background or fixed panel can duplicate this study’s lines, five-color Histogram, glow layers, separation fill, equilibrium band, yellow dots and readout. Glow and depth layers repeat the same values for styling and are not independent evidence.

  • Hide every other MACD, momentum and Histogram study while identifying this indicator’s white MACD, blue Signal and five-state Histogram.
  • Disable Histogram Depth, Line Glow and MACD/Signal Fill one at a time to verify that thicker shapes are styling layers over the same values.
  • Toggle signal-cross arrows, acceleration diamonds, zero-cross circles and yellow reactivation dots separately; distinguish their shape, color and pane position from other markers.
  • Keep the readout clear of other tables and avoid stacking phase tint with another state background. Never count an overlap as multiple confirmations.
03 — How to read it

A practical reading order

Go beyond a line cross. Read zero location, the five-state phase, relative magnitude, duration and cross-cycle retention in sequence.

Start with zero Location and Phase

Use Location for raw MACD above or below zero, then Phase for sign plus expansion, contraction or equilibrium. Do not turn green or magenta into an entry direction.

Separate Magnitude from Reactivation

Magnitude is relative to rolling history. A yellow dot only records that magnitude re-emerged after a sustained Subdued sequence; determine sign and phase separately.

Use Detailed mode for lifecycle context

Read acceleration, phase age, cross-cycle retention and path efficiency as related views of the same MACD series. Do not add them as independent confirmations.

Status and display terms

Positive Expansion / Positive Contraction

Histogram is above zero while absolute magnitude expands / contracts beyond the noise logic.

Negative Expansion / Negative Contraction

Histogram is below zero while absolute magnitude expands / contracts beyond the noise logic.

Near Equilibrium

Absolute raw Histogram is inside the adaptive equilibrium boundary; this is not a price-equilibrium claim.

Subdued / Typical / Extended

Low, ordinary or high relative Histogram magnitude inside the rolling history; not probability or overbought/oversold.

Magnitude Reactivation

Relative magnitude reached the reactivation threshold after a sustained Subdued sequence; non-directional by itself.

Cross Cycle / Peak Retention

Bars since the latest MACD/Signal cross / current absolute Histogram as a percentage of that cycle’s peak.

Efficiency / Confirmed / Live

MACD net displacement versus total travel / whether the bar is closed or still forming; not profitability or reliability.

04 — Settings reference

Settings reference

The labels below match the published script’s English Inputs panel. Defaults reflect the public source at the time of review and may change in a later TradingView update.

On small screens, each input is reformatted as a readable stacked card.

1. MACD Engine

7 inputs
Input labelDefault / optionsWhat it controls and when to adjust it
SourceCloseSelects the price series used by the fast and slow moving averages.
Fast Length12 (1–1000)Sets the fast moving-average length. It must remain lower than Slow Length.
Fast Average TypeEMA / SMA / RMA / WMA / HMA (default: EMA)Chooses EMA, SMA, RMA, WMA or HMA for the fast average.
Slow Length26 (2–2000)Sets the slow moving-average length. It must remain higher than Fast Length.
Slow Average TypeEMA / SMA / RMA / WMA / HMA (default: EMA)Chooses EMA, SMA, RMA, WMA or HMA for the slow average.
Signal Length9 (1–1000)Sets the smoothing length used to produce the Signal line from raw MACD.
Signal Average TypeEMA / SMA / RMA / WMA / HMA (default: EMA)Chooses EMA, SMA, RMA, WMA or HMA for the Signal line.

2. Display Scale

2 inputs
Input labelDefault / optionsWhat it controls and when to adjust it
Display ModeRaw MACD / Percent of Slow Average / ATR Units (default: Raw MACD)Chooses native MACD units, percent of the slow average, or ATR units. Analytical events continue to use the raw series.
ATR Length for ATR Units14 (1–1000; active for ATR Units)Sets the ATR length used only when Display Mode is ATR Units.

3. Momentum Dynamics

13 inputs
Input labelDefault / optionsWhat it controls and when to adjust it
Histogram Acceleration Smoothing3 (1–100)Smooths one-bar Histogram change. Display acceleration follows the selected unit while phase classification uses raw MACD structure.
Phase Noise Length8 (2–500)Estimates ordinary one-bar movement in absolute Histogram magnitude for the adaptive phase deadband.
Phase Noise Multiplier0.25 (0–5; step 0.05)Scales the phase deadband. Higher values require a clearer magnitude change before motion state can switch.
Adaptive Equilibrium Length34 (2–2000)Sets the lookback used to estimate recent mean absolute Histogram magnitude.
Equilibrium Band Multiplier0.28 (0–5; step 0.01)Scales the adaptive entry boundary for Near Equilibrium.
Equilibrium Exit Hysteresis1.25 (1–5; step 0.05)Widens the exit boundary after Near Equilibrium begins, reducing rapid boundary flapping.
Magnitude Rank Lookback120 (10–5000)Sets the rolling history for the 0–100 relative Histogram magnitude score.
Magnitude Score MethodHybrid Rank / Percent Rank / Range Rank (default: Hybrid Rank)Chooses observation Percent Rank, rolling Range Rank, or the default 65/35 Hybrid Rank.
Subdued Magnitude Threshold20 (0–99; step 1)Sets the upper score boundary for the descriptive Subdued state.
Magnitude Reactivation Threshold35 (1–100; step 1)Sets the score that records reactivation after a sustained Subdued sequence.
Extended Magnitude Threshold80 (1–100; step 1)Sets the lower score boundary for the descriptive Extended state.
Minimum Subdued Bars3 (1–100)Sets how many consecutive Subdued bars are required before reactivation can be armed.
MACD Path Efficiency Length20 (2–1000)Sets the lookback for net MACD displacement divided by total MACD travel, expressed from 0 to 100.

4. Visual Layers

13 inputs
Input labelDefault / optionsWhat it controls and when to adjust it
Show HistogramOnShows or hides the state-colored MACD Histogram.
Show Histogram Depth LayerOnAdds the wider translucent Histogram depth layer; it is not a second analytical series.
Fade Lower-Magnitude Histogram BarsOnFades Histogram bars with lower relative-magnitude scores.
Show MACD LineOnShows or hides the MACD line.
Show Signal LineOnShows or hides the Signal line.
Show Line GlowOnAdds translucent glow beneath the visible MACD and Signal lines.
Fill Between MACD and SignalOnFills the separation between MACD and Signal for visual context.
Show Adaptive Equilibrium BandOnShows the adaptive upper/lower Near Equilibrium boundary and its fill.
Show Momentum Phase Rail at ZeroOnColors a thick rail at zero by the current five-state momentum phase.
Show Phase Background TintOffAdds an optional pane-background tint for the current phase.
Background Transparency94 (75–100; active with phase background)Sets phase-background transparency; higher values are more transparent.
Line Fill Transparency88 (50–100; active with line fill)Sets transparency for the fill between MACD and Signal.
Histogram Depth Transparency78 (0–100; active with depth layer)Sets transparency for the wider Histogram depth layer.

5. Event Markers

4 inputs
Input labelDefault / optionsWhat it controls and when to adjust it
Signal-Line Cross MarkersOnShows factual MACD/Signal cross arrows at the pane edges.
Acceleration Turn MarkersOffShows optional diamonds where raw Histogram acceleration crosses zero.
MACD Zero-Cross MarkersOffShows optional circles when raw MACD crosses zero.
Magnitude Reactivation MarkersOnShows a yellow pane-top dot when relative Histogram magnitude reactivates after a sustained Subdued sequence.

6. Context Readout

7 inputs
Input labelDefault / optionsWhat it controls and when to adjust it
Readout ModeOff / Compact / Detailed (default: Compact)Chooses Off, Compact or Detailed context readout.
Readout PositionTop Left / Top Center / Top Right / Middle Left / Middle Right / Bottom Left / Bottom Center / Bottom Right (default: Top Right)Chooses the readout position. Move it when another indicator occupies the same area.
Readout Text SizeTiny / Small / Normal / Large / Huge (default: Normal)Sets the body-text size in the context readout.
Header Text SizeTiny / Small / Normal / Large / Huge (default: Normal)Sets the context-readout header size.
Readout BackgroundRGB 16, 20, 30Sets the readout body background color.
Readout Header BackgroundRGB 35, 42, 58Sets the readout header background color.
Readout BorderRGB 75, 88, 112Sets the readout frame and border color.

7. Visual Palette

9 inputs
Input labelDefault / optionsWhat it controls and when to adjust it
MACD LineIce white (RGB 245, 247, 250)Sets the MACD-line color.
Signal LineElectric blue (RGB 41, 121, 255)Sets the Signal-line color.
Positive ExpansionBright green (RGB 0, 230, 118)Sets the color for positive Histogram magnitude expansion.
Positive ContractionTeal (RGB 0, 191, 165)Sets the color for positive Histogram magnitude contraction.
Negative ExpansionMagenta (RGB 255, 45, 122)Sets the color for negative Histogram magnitude expansion.
Negative ContractionOrange (RGB 255, 145, 0)Sets the color for negative Histogram magnitude contraction.
EquilibriumVivid purple (RGB 213, 0, 249)Sets the color for the adaptive Near Equilibrium phase.
Zero GuideBlue grey (RGB 120, 144, 156)Sets the zero-guide color.
Magnitude Reactivation MarkerYellow (RGB 255, 234, 0)Sets the non-directional Magnitude Reactivation marker color.

8. Alerts

6 inputs
Input labelDefault / optionsWhat it controls and when to adjust it
Confirmed Bars OnlyOnRestricts markers, alerts and committed state updates to confirmed bars; live plots and readout can still change on the open bar.
Enable Signal-Line Cross AlertsOnEnables alerts for MACD crossing above or below Signal.
Enable MACD Zero-Cross AlertsOffEnables alerts for MACD crossing above or below zero.
Enable Acceleration Turn AlertsOnEnables alerts when raw Histogram acceleration crosses zero.
Enable Magnitude Reactivation AlertOnEnables the non-directional Magnitude Reactivation alert.
Enable Momentum Phase AlertsOffEnables alerts for transitions into each of the five momentum phases.
05 — Alerts

Confirmed cross, acceleration, magnitude and phase events

Alerts report MACD/Signal crosses, MACD zero crosses, Histogram-acceleration turns, Magnitude Reactivation and five-state phase transitions. They are not trade instructions or forecasts.

  • MACD crossed above or below Signal reports a confirmed line-order change, not an entry or exit.
  • MACD zero crosses and Histogram-acceleration turns report factual calculation changes, not a price reversal forecast.
  • Magnitude Reactivation reports renewed relative magnitude after a sustained Subdued sequence and carries no direction by itself.
  • Five separate phase-transition conditions report entry into Positive Expansion, Positive Contraction, Negative Expansion, Negative Contraction or Near Equilibrium.
06 — Limitations and responsible use

Not a buy/sell signal

This tool is for analysis and visualization. It is not investment advice, a trade recommendation, a forecast, or a promise of profit or accuracy. Results depend on inputs, symbol, timeframe, and data feed. You remain responsible for every trading decision.

Moving-average lag remains

MACD is derived from moving averages. Phase, magnitude, acceleration, retention and efficiency describe current and historical calculations; they do not forecast price.

Ranks and boundaries depend on windows

Rolling rank changes as old observations leave its window. Noise, equilibrium, reactivation and Extended classifications depend on the selected lengths and thresholds.

The open bar remains fluid

Confirmed Bars Only gates markers, alerts and committed state updates. Lines, Histogram, phase and readout can still change with live price before the bar closes.

Current chart only

The script does not request another symbol or timeframe, use lookahead, access future data or apply a future offset. Short timeframes, gaps and illiquid markets can create rapid state changes.

Important

MACD, Signal, Histogram, phase, magnitude, reactivation, acceleration, retention and efficiency are related outputs from the same MACD series. Do not count them as independent trade signals or convert them into an entry, exit, target, stop, size or win-rate estimate.

07 — FAQ

Frequently asked questions

Clarify the difference from standard MACD, display units, the yellow dot and confirmed versus live behavior.

Is MACD Momentum Phase & Acceleration Observatory free to use?

Yes. It is a free, open-source indicator published by SG Group on TradingView. Review TradingView’s terms and the conditions attached to the public script before reuse or redistribution.

Should I change the settings immediately?

Start with the published defaults and observe the drawings and state changes first. Then change one input at a time for the symbol, timeframe and data feed so you can identify what caused each visual change.

Can I display it with other indicators?

Yes, but similar lines, bands, backgrounds and tables can overlap and obscure their source. Isolate each indicator first and hide duplicate components. Visual overlap alone is not stronger evidence or signal agreement.

Does the display provide trade signals?

No. It is analysis and visualization context consistent with the public description. It does not provide entries, exits, targets, stops, price forecasts, or promises of profit, win rate or accuracy.

Is the yellow Magnitude Reactivation dot bullish?

No. It only records that relative absolute-Histogram magnitude re-emerged after a sustained Subdued sequence. Read direction separately from Histogram sign and phase; it is not an entry or price forecast.

Source basis and update policy

This guide is grounded in SG Group’s live catalogue, the script’s published TradingView description, and the user-facing inputs in its open source. Labels and defaults can change after a script update.