Anchored VWAP Origin Chronicle Guide | SG Group
Skip to content
Japanese page

FreeOpen sourcePine Script v6

TradingView Free Indicator

Study chart-reported volume-weighted price from three independently managed origins: one manual chart point, the latest accepted confirmed swing high and the latest accepted confirmed swing low. Make pivot-confirmation delay, pair context and visible-range volume integrity explicit.

VWAP / Average Price
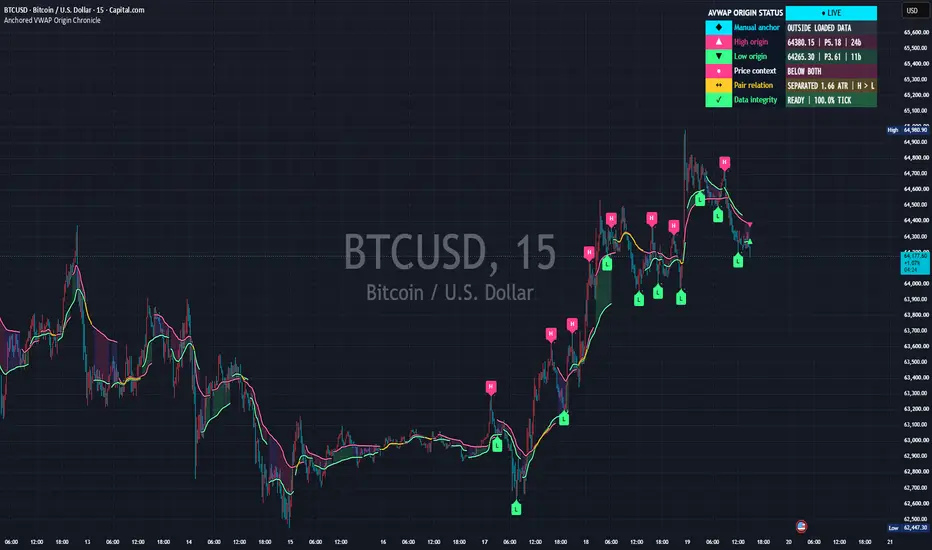
Real chart published on TradingView: Anchored VWAP Origin Chronicle - Manual Swing High and Low
Real chart image from the published TradingView page. The symbol, timeframe, settings and prices shown are a captured example, not current data or a trading result.
PurposeCompare volume-weighted price from three origins
Best forUsers comparing a chosen event with confirmed swing-high and swing-low origins
Primary outputThree AVWAPs, M/H/L origins, pair context and readout
Chart placementPrice-chart overlay
01 — Overview

Separate where an AVWAP begins from when its origin became knowable

Each manual-, high- and low-origin AVWAP independently divides cumulative source times positive chart-reported volume by cumulative positive volume. It is not session-reset VWAP, a deviation-band study, prediction model, strategy or buy/sell signal.

What it visualizes

Cyan manual, magenta high-origin and green low-origin AVWAPs; dark halos; optional precision cores; M/H/L origin markers; pivot-to-confirmation bridges; endpoints; pair fill; an amber convergence spine; and a readout covering origins, price context, pair relation and data integrity.

How it works

Each accumulator gives zero weight to missing, zero, negative or unusable volume; there is no equal-weight or TWAP fallback. Automatic origins must pass left/right pivot structure, ATR-normalized prominence, same-type spacing, optional relative volume and the selected replacement policy.

Manual time and price have different roles

Manual time selects the first included chart bar. Manual price only places the M marker and does not change AVWAP. An origin before loaded history is blocked; an origin outside the visible range hides the manual line by default.

Automatic origins are delayed until confirmation

H/L labels sit on the actual pivot bar, but an origin cannot activate until the configured right-side bars have elapsed. The dotted bridge and optional confirmation marker expose that delay instead of implying prior knowledge.

Describe the automatic pair

The readout classifies price above both, below both or between them; reports separation in ATR units; identifies convergence; and shows whether the high-origin curve is above or below the low-origin curve. None predicts direction.

02 — Install and start

Add it to TradingView

Add the public script to a standard-candlestick price chart. Under the defaults, identify the manual M origin, confirmed H and L origins, three AVWAPs and the readout before changing one input at a time.

Anchored VWAP Origin Chronicle – Manual Swing High and Low

Open the public Anchored VWAP Origin Chronicle – Manual Swing High and Low page and add it to a TradingView chart. Select one important chart point for the interactive manual origin. No SG Group account is required.

  1. Open the “Use on TradingView” link below.
  2. Select “Use on chart” on TradingView to add the script to your chart.
  3. Open the gear icon, then Settings → Inputs, and observe the default configuration first.
  4. Change one input at a time for the symbol and timeframe you are studying.
Observe the defaults firstChange one input at a timeVerify symbol, timeframe and feed

Prevent misreads when indicators overlap

Overlapping lines, bands, backgrounds or tables can be duplicate drawings of the same kind of information. Never treat visual overlap by itself as stronger evidence or signal agreement. Standard VWAP, daily VWAP, another anchored or multi-anchor VWAP, moving averages, envelopes and support/resistance tools can duplicate the three AVWAPs, halo, precision core, fill, convergence spine, M/H/L markers, endpoints and readout. Halo, core and fill are styling layers over the same values, not separate evidence.

  • Hide standard VWAP, daily VWAP, every other anchored VWAP, moving average and support/resistance tool while identifying the cyan, magenta and green AVWAPs.
  • Toggle high-contrast halo, thin precision core, pair fill and overlap highlight separately to verify that thicker or central shapes are styling over the same curves.
  • Toggle origin markers, confirmation markers, pivot-to-confirmation bridges and each optional event marker separately; distinguish pivot location from later confirmation.
  • Move the readout away from other fixed panels and preserve right-axis labels. Never count coincident lines or markers as multiple confirmations.
03 — How to read it

A practical reading order

Keep manual, high and low origins separate. Then read price above, between or below the automatic pair, pair convergence and usable-volume status in order.

Match origin and confirmation time

Locate M, H and L, then follow each automatic bridge to the later confirmation bar. Do not apply an origin known later to decisions on earlier bars.

Read the three origin rows

Check ◆ Manual anchor, ▲ High origin and ▼ Low origin for value, age and state. Respect OUTSIDE LOADED DATA, ORIGIN OUTSIDE VIEW, BLOCKED and NO VOLUME.

Check price, pair and volume context

Use ● Price context for above/between/below, ↔ Pair relation for separation/convergence/order, and ✓ or ! Data integrity for READY, PARTIAL or SYNTHETIC. READY is only a configured coverage threshold, not data certification.

Status and display terms

M / H / L

Manual / confirmed swing-high / confirmed swing-low origin. H and L become knowable only after right-side confirmation.

LIVE / CLOSED / HISTORY

The right edge is live, the market is closed, or the visible right edge is historical.

Above both / Between / Below both

Price-context source is above, between or below the two automatic AVWAPs; not a trade direction.

Separated / Converged

Pair separation is above / at or below the configured ATR convergence threshold.

READY

Positive usable-volume coverage in the visible range meets the configured threshold; not data certification.

PARTIAL / NO VOLUME

Usable volume is incomplete / absent. The study does not substitute equal weighting.

BLOCKED / SYNTHETIC

Calculated-price chart use is blocked / deliberately allowed by the user.

OUTSIDE LOADED DATA / ORIGIN OUTSIDE VIEW

The origin predates loaded history / sits outside the current visible range.

04 — Settings reference

Settings reference

The labels below match the published script’s English Inputs panel. Defaults reflect the public source at the time of review and may change in a later TradingView update.

On small screens, each input is reformatted as a readable stacked card.

1. Manual Anchor

4 inputs
Input labelDefault / optionsWhat it controls and when to adjust it
Show manual AVWAPOnDisplays a VWAP beginning on the bar selected by the interactive anchor point.
Hide manual AVWAP when origin is outside viewOnKeeps the chart focused on the current visible time range. Disable this only when you intentionally want a manual AVWAP to remain visible after its anchor has moved outside the viewport.
Manual anchorInteractive price pointThe selected price positions the M marker only. It does not alter the VWAP calculation.
Manual anchor time2024-01-01 00:00 UTC / interactive time pointClick an important chart point when adding the script. Time selects the first included bar; price positions the M marker only.

2. Confirmed Swing Anchors

11 inputs
Input labelDefault / optionsWhat it controls and when to adjust it
Show confirmed swing-high AVWAPOnDisplays the AVWAP whose origin is the latest accepted, confirmed swing high. It is managed independently from the low origin.
Show confirmed swing-low AVWAPOnDisplays the AVWAP whose origin is the latest accepted, confirmed swing low. It is managed independently from the high origin.
Pivot bars left8Bars required to the left of a candidate pivot.
Pivot bars right5Bars required to the right before a pivot is confirmed. Automatic anchors never activate before this delay has elapsed.
Minimum local prominence in ATR1A high must stand this many ATR above the completed pivot window low. A low must stand this many ATR below the completed pivot window high.
Minimum bars between same-type anchors15Reduces rapid replacement of one high-origin anchor by another high, and likewise for low-origin anchors.
Automatic anchor replacement policyLatest qualified / options: Latest qualified, More prominent only, New price extreme onlyLatest qualified follows every accepted swing. More prominent only requires an ATR-prominence improvement. New price extreme only requires a higher high or lower low.
Prominence improvement margin in ATR0.1Used by More prominent only. A replacement must improve on the active same-type origin by at least this ATR-normalized amount.
Require relative volume at swing originOffWhen enabled, an automatic origin is accepted only when chart-reported volume on the pivot bar meets the selected ratio versus its moving average.
Relative volume average length50Sets the moving-average length used as the relative-volume baseline when the swing-origin volume filter is enabled.
Minimum relative volume ratio1Sets the minimum pivot-bar volume divided by its volume average. A value of 1.0 requires at least average volume.

3. Calculation

6 inputs
Input labelDefault / optionsWhat it controls and when to adjust it
VWAP sourcehlc3 / options: open, high, low, close, hl2, hlc3, hlcc4, ohlc4Price source multiplied by the volume series supplied by the chart.
Price-context sourceclose / options: open, high, low, close, hl2, hlc3, hlcc4, ohlc4Used only for confirmed cross events and the above, between, or below pair classification.
ATR length14Used for swing-prominence normalization and the swing-pair spread readout.
Pair convergence threshold in ATR0.25The two automatic AVWAPs are classified as converged at or below this ATR-normalized separation.
Allow calculated-price chart typesOffDisabled by default. Heikin Ashi, Renko, Kagi, Line Break, Point and Figure, and Range charts use calculated prices. Enable only when you intentionally want this script to use those chart prices.
Minimum volume coverage for READY status90Classifies volume coverage in the readout. It never fills missing volume and never changes the AVWAP formula.

4. Visuals

25 inputs
Input labelDefault / optionsWhat it controls and when to adjust it
Fill between swing-origin AVWAPsOnFills between the high-origin and low-origin AVWAPs to show their relationship. The fill is not independent evidence.
Use high-contrast line haloOnDraws a wider dark line below each bright AVWAP for visibility on both light and dark charts.
Show thin precision coreOnAdds a one-pixel light center trace inside each colored AVWAP. This keeps the exact path readable when candles or filled areas use similar colors.
Precision core transparency58Controls transparency of the thin center trace. Zero is opaque; higher values are more transparent.
Highlight overlapping swing AVWAPsOnDraws a thin amber spine at the midpoint while the high-origin and low-origin AVWAPs are within the configured convergence threshold. It identifies overlap without moving either AVWAP.
Show active AVWAP endpointsOnAdds one compact symbol at the latest visible value of each active AVWAP: diamond for manual, downward triangle for high origin, and upward triangle for low origin.
Show origin markersOnM is the manual point. H and L mark confirmed pivot origins.
Show confirmation markersOffOptional markers identify the later bar where each automatic pivot became knowable. They are hidden by default to keep the publication view clean.
Show pivot-to-confirmation bridgesOnA dotted bridge makes the automatic pivot confirmation delay explicit instead of implying that the origin was known on the pivot bar.
Confirmation marker styleC badge / options: C badge, DotUsed only when confirmation markers are enabled. C badge is explicit; Dot is more compact.
Show confirmed price-cross markersOffSmall circles mark bar-close crosses of active AVWAPs. They are factual events, not trade signals.
Show pair-convergence markersOffMarks confirmed entries into the configured convergence zone. This is a relationship event, not a directional signal.
Show swing-pair order-flip markersOffMarks confirmed crosses between the high-origin and low-origin AVWAP curves. These are relationship events, not trade signals.
Event marker width3Controls optional cross, convergence-event, and pair-order markers. These markers are hidden by default to keep the AVWAP paths unobstructed.
Confirmed swing events retained18Limits H/L origin labels, optional confirmation markers, and dotted confirmation bridges retained inside the current visible chart range.
Main line width2Controls the width of each main AVWAP line without changing its calculation.
Halo extra width2Sets how much wider the dark contrast halo is than the main AVWAP line.
Halo transparency10Controls transparency of the dark contrast halo.
Pair fill transparency84Controls transparency of the fill between the two automatic AVWAPs.
Manual AVWAP color#00E5FFSets the color of the manual-origin AVWAP and its related visual cues.
Swing-high AVWAP color#FF3D8DSets the color of the confirmed swing-high-origin AVWAP and related cues.
Swing-low AVWAP color#39FF88Sets the color of the confirmed swing-low-origin AVWAP and related cues.
Between-pair fill color#7C4DFFSets the color used to fill between the two automatic AVWAPs.
Pair relationship event color#FFCA28Sets the color of pair-convergence and relationship-event drawings.
Contrast halo color#05080FSets the dark color drawn beneath each bright AVWAP for contrast.

5. Anchor Readout

5 inputs
Input labelDefault / optionsWhat it controls and when to adjust it
Show anchor readoutOnShows the panel summarizing the three origins, price context, pair relationship and volume integrity.
Readout positionTop Right / options: Top Right, Top Left, Bottom Right, Bottom LeftRight-side positions keep the panel in the chart corner while reserving only a small transparent clearance for right-axis High and Low labels.
Right-axis clearance percent2Small transparent clearance between a right-side panel and the price scale, measured as a percentage of pane width. The two-percent default keeps the panel distinctly upper-right while preserving room for High and Low scale labels.
Readout text sizeNormal / options: Tiny, Small, Normal, LargeSets the readout text size. Keep the panel separate from other fixed tables.
Readout background transparency4Controls readout background transparency; preserve enough contrast for legibility.

6. Alerts

6 inputs
Input labelDefault / optionsWhat it controls and when to adjust it
Enable dynamic alertsOffAfter enabling this input, create one TradingView alert using Any alert() function call.
Alert on new confirmed swing anchorsOnIncludes newly accepted, confirmed swing-high and swing-low origins in dynamic alerts.
Alert on confirmed AVWAP crossesOnIncludes bar-close price crosses of active AVWAPs in dynamic alerts.
Alert when price enters above-both or below-both contextOnAlerts on a confirmed transition into price above both or below both automatic AVWAPs; it is not a recommendation.
Alert when the swing pair enters convergenceOnAlerts when the two automatic AVWAPs enter the configured convergence zone on a confirmed bar.
Alert when swing-origin AVWAP order flipsOnAlerts when the high-origin and low-origin AVWAP curves reverse their vertical order on a confirmed bar.
05 — Alerts

Dynamic alerts for confirmed origin, cross and pair events

Alerts report accepted confirmed swing origins, confirmed price crosses, pair-context entries, convergence entries and AVWAP order flips. They are not instructions or forecasts.

  • A newly accepted, confirmed swing-high or swing-low origin.
  • A confirmed price cross of the manual-, high- or low-origin AVWAP.
  • A confirmed transition into price above both or below both automatic AVWAPs.
  • A confirmed convergence entry or vertical-order flip of the automatic pair.
  • Enable Dynamic alerts, then create one TradingView alert for this indicator using Any alert() function call.
06 — Limitations and responsible use

Not a buy/sell signal

This tool is for analysis and visualization. It is not investment advice, a trade recommendation, a forecast, or a promise of profit or accuracy. Results depend on inputs, symbol, timeframe, and data feed. You remain responsible for every trading decision.

Volume type and coverage matter

The chart may report exchange, base, quote, tick, other or no usable volume. Missing volume is never filled. Tick volume is not aggressor-side flow or an order book.

Confirmed pivots require right-side delay

An automatic origin is not knowable until the configured right bars exist. After confirmation, accumulation starts at the actual pivot, but the line is not backfilled before confirmation and breaks on the replacement bar.

Visible range affects presentation

Origin labels, endpoints, retained drawings, volume statistics and the readout follow the visible horizontal range. The underlying AVWAP origin does not restart at the left screen edge. Distinguish LIVE, CLOSED and HISTORY.

Calculated-price charts are blocked by default

Heikin Ashi, Renko, Kagi, Line Break, Point and Figure and Range charts use calculated prices. Opt-in shows SYNTHETIC and does not make their prices or volume equivalent to standard candles.

Important

The three AVWAPs, price context, separation, convergence, pair order and volume state are related descriptions derived from the same chart data and origins. Do not count them as independent signals or automatically convert them into support, resistance, entry, exit, target, stop or probability.

07 — FAQ

Frequently asked questions

Clarify manual-price behavior, pivot delay, READY, calculated-price charts and the visible-range presentation.

Is Anchored VWAP Origin Chronicle – Manual Swing High and Low free to use?

Yes. It is a free, open-source indicator published by SG Group on TradingView. Review TradingView’s terms and the conditions attached to the public script before reuse or redistribution.

Should I change the settings immediately?

Start with the published defaults and observe the drawings and state changes first. Then change one input at a time for the symbol, timeframe and data feed so you can identify what caused each visual change.

Can I display it with other indicators?

Yes, but similar lines, bands, backgrounds and tables can overlap and obscure their source. Isolate each indicator first and hide duplicate components. Visual overlap alone is not stronger evidence or signal agreement.

Does the display provide trade signals?

No. It is analysis and visualization context consistent with the public description. It does not provide entries, exits, targets, stops, price forecasts, or promises of profit, win rate or accuracy.

If H or L marks the pivot bar, was that origin known on that bar?

No. A swing becomes knowable only after the configured right-side bars have elapsed. H/L marks the actual origin, while the bridge and optional confirmation marker show the later confirmation time; the line is not backfilled before confirmation.

Source basis and update policy

This guide is grounded in SG Group’s live catalogue, the script’s published TradingView description, and the user-facing inputs in its open source. Labels and defaults can change after a script update.