Linear Regression Channel Fit Audit Guide | SG Group
Skip to content
Japanese page

FreeOpen sourcePine Script v6

TradingView Free Indicator

Did price fit the model available beforehand, or did the model move to fit price? Separate the current regression, the preceding model and scheduled fixed-origin paths to study slope, refitting and subsequent observations.

Linear Regression / Model-update Diagnostics
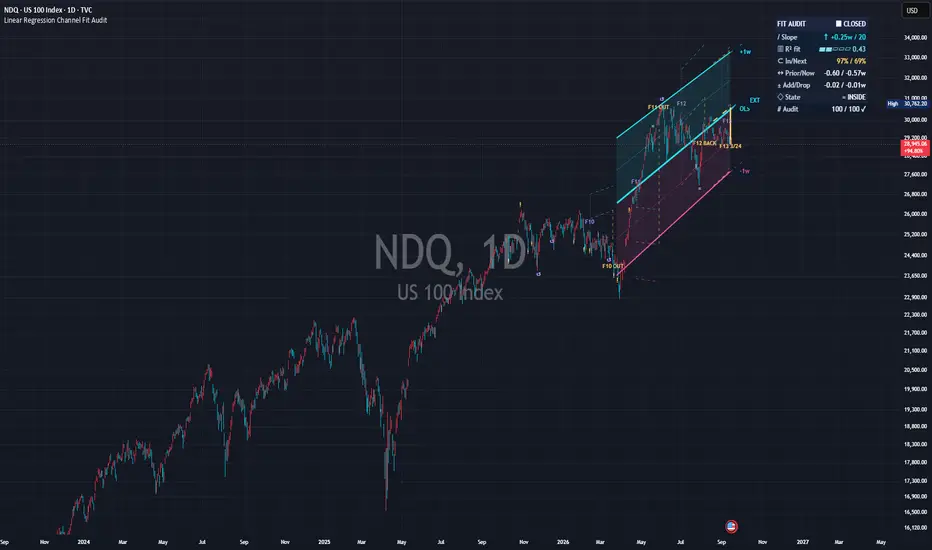
Real chart published on TradingView: Linear Regression Channel Fit Audit
Real chart image from the published TradingView page. The symbol, timeframe, settings and prices shown are a captured example, not current data or a trading result.
PurposeSeparate historical fit from evaluation against previously available models
Best forUsers examining statistical slope and how refitting or widening changes apparent containment
Primary outputCurrent channel, prior references, fixed paths and four diagnostic panel pages
Chart placementPrice-chart overlay
01 — Overview

Compare price movement with movement of the fitted model

An ordinary least-squares center and residual envelope are combined with update attribution and scheduled fixed-model research. The study separates removing an old observation from adding a new one, and center movement from width changes. Scheduled origins are not selected retrospectively by outcomes.

What it visualizes

Solid cyan/pink boundaries enclose the current center marked OLS. ±1w means one selected half-width, not necessarily one standard deviation. Dashed EXT is a geometric continuation excluded from statistics and alerts. Amber marks the preceding model; thin F-numbered channels retain their origin parameters.

How it works

Fits N consecutive Source values against equally spaced bar positions in price units, not log prices or elapsed calendar time. A residual is Source minus fitted value at the same window position. Default N is 120 and half-width is twice the square root of residual SSE divided by 118.

Three residual widths

Standard error uses multiplier × sqrt(SSE/(N−2)); mean absolute residual uses multiplier × mean absolute residual; percentile uses a nearest-rank absolute residual. The percentile ignores the multiplier. Mean absolute residual is not median absolute deviation. Tick and numerical floors can dominate nearly exact-line data.

Attributing center updates

Evaluate the previous model, common N−1-observation model and new model at the same current coordinate. Drop = common minus previous; Add = new minus common. Their sum is total center movement. The stipulated order removes the oldest value before adding the newest; displayed units are prior half-widths, not percentages.

Attributing containment margin

Margin equals half-width minus absolute residual. Center contribution is old absolute residual minus new absolute residual; width contribution is new width minus old width. Divide both by prior width and their sum equals normalized margin change. This is geometric attribution, not economic causality.

Matched before and after

The same confirmed observations are measured before/after refitting. Coverage change equals (included count minus excluded count) divided by paired count, or 100 times this for percentage points. After includes each observation in its own fit and is not an out-of-sample forecast.

One-step and H-step endpoints

Extend the earlier model by one or H bars while retaining origin width. Skill = 100 × (1 − model squared-error sum / unchanged-origin-Source squared-error sum). Positive is smaller error than the matched baseline; negative is worse and zero baseline error is unavailable. It is not a return or win rate.

Scheduled whole paths

Keep origin center, slope and width unchanged while evaluating the next L confirmed Source observations. Default L24 plus gap24 schedules origins 48 bars apart. The origin itself is not an outcome, and an exit neither resets the model nor deletes the path.

02 — Install and start

Add it to TradingView

Use standard time-based candles and a price-valued source. Begin with close, length 120, twice the residual standard error and Confirmed close updates. Read Model first, then compare the observation against the model available beforehand.

Linear Regression Channel Fit Audit

Open the public Linear Regression Channel Fit Audit page and add it to TradingView. No SG Group registration is required.

  1. Open the “Use on TradingView” link below.
  2. Select “Use on chart” on TradingView to add the script to your chart.
  3. Open the gear icon, then Settings → Inputs, and observe the default configuration first.
  4. Change one input at a time for the symbol and timeframe you are studying.
Observe the defaults firstChange one input at a timeVerify symbol, timeframe and feed

Prevent misreads when indicators overlap

Overlapping lines, bands, backgrounds or tables can be duplicate drawings of the same kind of information. Never treat visual overlap by itself as stronger evidence or signal agreement. Current fit, preceding-model reference, successive one-step traces, F-numbered paths and EXT have different roles. Other channels can obscure those roles or make related lines look like independent evidence.

  • Hide other channels first and identify OLS, ±1w, EXT and F labels.
  • Do not mistake successive one-step references for a single fixed-origin path.
  • Refit inclusion takes glyph priority when events coincide. Consult numeric flags for hidden or spaced events.
  • Separate panels using clearances. Glyphs outside candle wicks are annotations, not event or execution prices.
03 — How to read it

A practical reading order

Move through four panel pages while keeping fitting samples, endpoint tests and completed-path samples distinct. Tooltips provide further context.

Read Model

Slope is fitted change over 20 bars divided by current half-width. R² measures in-window fit; constant data are unavailable and the five-part meter is coarse. In/Next uses different samples. Prior/Now use different denominators, so subtracting them is not a raw-price change. A full-sample check mark is not a performance pass.

Inspect detailed diagnostics

Residual persistence is the adjacent-residual product sum divided by SSE, not a significance test. Older/recent half-window slopes share the full-window width; odd N assigns the extra observation to the older half.

Explain refit inclusion

CENTER means center movement alone suffices; WIDTH means width alone; JOINT needs both; EITHER permits either alone. These compare new-center/old-width and old-center/new-width geometries. Their counts sum to inclusion count, without proving a price reversal.

Read endpoint research

Compare one-step and H-step results with their own identical-sample baselines. The two horizons may have different eligible counts. H-step output includes absolute error, baseline error, error in origin-width units and upper/lower misses. Overlapping endpoint tests are dependent.

Separate End from All

Frozen-path End count equals All plus Back over the same valid completed paths. An exit at age6 followed by an inside endpoint at age24 is BACK, not ALL. With close as Source, containment tests closes rather than every intrabar wick.

Read matched path references

F/A compares origin fitted-center extrapolation with origin Source plus the same slope, against a common unchanged-Source baseline. Only the starting level changes. Scores pool squared errors, not path percentages. Roll/Fix compares updating-only and fixed-only containment on matched observations, but updating has intermediate information and possibly different widths.

Select an as-of close

Set the interval and check the actual selected close. Later candles remain visible, so research is not blind replay. Unfinished paths at cutoff remain open. Later timestamps may place annotations, but later Source prices do not enter the selected model or statistics.

Record numeric page and flags

Numeric history can differ from the visible panel. Record M/R/H/F and page ID. Cause codes: 0 none, 1 center, 2 width, 3 joint, 4 either. Event bits: 1 outside, 2 inside again, 4 refit inclusion, 8 exclusion, 16 coverage gap, 32 split disagreement, 64 path start, 128 completion, 256 first exit. Coexisting bits add; glyph filtering does not remove them.

Status and display terms

OLS / ±1w / EXT

Fitted center / selected half-width boundaries / geometric extension excluded from research.

! / ↺ / =; O / R / I

Outside transition / refit inclusion / inside-again transition. Placement is not a trade price.

CENTER / WIDTH / JOINT / EITHER

Center alone / width alone / both required / either sufficient.

F; ALL / BACK / OUT

Fixed-path ID. All observations inside / final inside after an exit / final outside, classified at maturity.

DATA / k/L

Missing-data path / unfinished progress k of L, not a successful result.

End/All; Back/Exit; Done/Open

Endpoint/all-observation containment; back-inside/any-exit; valid completions/open age.

PHASE*

Loaded-history sensitivity of the scheduled origin phase.

RANGE > CAP

Research interval exceeds its budget; remaining partial records are not full results.

START > END; NO ELIGIBLE BAR; WARM-UP / DATA

Reversed interval / no eligible close / insufficient warm-up or data.

04 — Settings reference

Settings reference

The labels below match the published script’s English Inputs panel. Defaults reflect the public source at the time of review and may change in a later TradingView update.

On small screens, each input is reformatted as a readable stacked card.

00 Research target and horizon

5 inputs
Input labelDefault / optionsWhat it controls and when to adjust it
ViewLatest / options: Latest, As-of researchLatest follows the current snapshot. As-of research reconstructs the last admitted confirmed close and disables alerts; use standard time-based candles.
Research start2026-01-01 00:00 UTCResearch starts at 2026-01-01 00:00 UTC by default. Training may precede the interval, but test origins must be admitted; one-step and H-step outcomes need their earlier in-interval models.
As-of cutoff2026-09-01 00:00 UTCDefault cutoff is 2026-09-01 00:00 UTC. Only closes at or before it qualify; check the selected close in exchange time. It does not crop or scroll the chart.
Research statisticsRolling audit / options: Rolling audit, Selected intervalRolling audit uses the recent K bars; Selected interval aggregates eligible tests throughout the interval. Actual valid counts matter, and frozen paths have separate slot retention.
Second frozen horizon, bars5 / min 2, max 50Second endpoint horizon H, default five. Extends the model from H bars earlier with its original width; overlapping tests are dependent and do not test whole-path containment.

01 Regression and residual width

7 inputs
Input labelDefault / optionsWhat it controls and when to adjust it
Sourceclose / options: open, high, low, close, hl2, hlc3, hlcc4, ohlc4Price-valued input: close by default; open/high/low, midpoint and OHLC averages are alternatives. External sources can repaint; missing observations invalidate a fit rather than being skipped.
Regression length120 / min 12, max 500Number of consecutive observations per regression, default 120. This is separate from the historical workload budget.
Snapshot updatesConfirmed close / options: Confirmed close, Live previewConfirmed close holds the closed-bar snapshot; Live preview allows intrabar refitting of that snapshot. Research totals, path observations, events and alerts still use confirmed closes.
Width methodResidual standard error / options: Residual standard error, Mean absolute residual, Residual percentileChoose residual standard error, mean absolute residual, or a nearest-rank absolute-residual percentile. None constructs a confidence or prediction interval.
Residual multiplier2 / min 0.1, max 8Multiplier for standard error or mean absolute residual only, default two. Percentile width ignores it; it does not imply a normal-distribution coverage guarantee.
Absolute-residual percentile90 / min 50, max 99.5Nearest-rank percentile of absolute fitted residuals, default 90. It concerns the fitting window, not a future 90% coverage target; the multiplier is unused.
Minimum half-width, symbol ticks2 / min 0.1, max 100Minimum half-width in symbol ticks, default two. Together with a numerical floor it prevents zero division and may dominate flat or nearly exact-line samples.

02 Fit diagnostics

5 inputs
Input labelDefault / optionsWhat it controls and when to adjust it
Rolling audit window, bars100 / min 20, max 500Recent audit window K, default 100 bars. Counts only valid confirmed tests within those bars; overlapping fits are not independent trials.
Slope measurement span, bars20 / min 1, max 250Span for expressing fitted price change, default 20 bars, normalized by current half-width. It is neither an annualized return nor a screen angle.
Flat slope threshold, half-widths0.05 / min 0, max 3Flatness threshold in half-width units, default 0.05. Width changes can alter normalized slope and its classification.
Coverage-gap highlight, percentage points10 / min 1, max 80Highlight threshold for in-fit coverage exceeding next-bar coverage, default 10 percentage points, after a full valid sample. These are different populations, not a significance test.
Residual persistence highlight0.6 / min 0.1, max 0.99Threshold for the absolute lag-one residual-product ratio, default 0.6. Describes persistence without a significance test.

03 Channel and reference drawings

18 inputs
Input labelDefault / optionsWhat it controls and when to adjust it
Current fitted channelOnShows the current fitted center and boundaries; the historical fitted segment redraws as the window moves.
Inner guidesOnShows dotted inner guides.
Width fraction0.5 / min 0.1, max 0.9Inner-guide distance as a fraction of the selected half-width, default 0.5.
Channel shadingOnEnables channel shading.
Transparency91 / min 75, max 99Shading transparency, default 91; higher values are fainter.
Dashed geometric extensionOnShows the dashed geometric continuation, not a forecast range.
Bars12 / min 1, max 100Geometric extension length, default 12 bars. The EXT segment does not enter research statistics or alerts.
Previous-model referenceOnShows the amber model reference computed before the displayed observation was included.
Visible bars18 / min 2, max 120Visible span of the preceding-model reference, default 18 bars. Its endpoint at the displayed observation is the one-step reference.
Older / recent half-window fitsOffShows separate regressions on the older and recent halves, with one extra older observation for odd lengths. These diagnose shape, not separate trading systems.
Latest one-step residual connectorOnConnects the latest observation to its one-step reference center.
Compact endpoint tagsOnShows compact endpoint labels such as OLS and ±1w.
Tag offset, bars2 / min 1, max 20Horizontal label offset in bars, default two.
Historical frozen one-step centerOffConnects successive one-step reference centers. Each point has its own preceding model; this is not one permanently fixed channel.
Historical frozen one-step boundariesOffShows successive one-step boundary traces, distinct from a scheduled fixed-origin path.
Latest reference display, bars240 / min 50, max 4000Reference-trace display span in Latest, default 240 bars. Research uses the admitted interval instead.
Center line thickness3 / min 1, max 5Center-line thickness, default three.
Boundary thickness2 / min 1, max 5Boundary thickness, default two.

04 Compact information panel

9 inputs
Input labelDefault / optionsWhat it controls and when to adjust it
Show information panelOnShows the information panel.
Panel pageModel / options: Model, Refit research, Horizon research, Frozen pathsSelect Model, Refit research, Horizon research or Frozen paths. All pages share the same eight-row panel geometry and font size.
DetailCompact / options: Compact, DetailedCompact keeps the concise readout; Detailed adds diagnostic values.
Text size12 / min 9, max 18Panel text size, default 12, range 9–18.
Bold valuesOnMakes values bold.
Bold row headingsOnMakes row headings bold.
Panel symbols and metersOnShows supplementary icons and fit meter. Disabling them does not change position, row count or font size.
Right clearance, chart percent3 / min 0, max 12Right clearance as chart percentage, default 3%.
Top clearance, chart percent2 / min 0, max 12Top clearance as chart percentage, default 2%.

05 Colors

7 inputs
Input labelDefault / optionsWhat it controls and when to adjust it
Upper / rising#24E4F2Upper boundary/rising color, cyan by default; not a buy instruction.
Lower / falling#FF55ABLower boundary/falling color, pink by default; not a sell instruction.
Prior reference#FFD166Previous-model reference color, amber by default.
Split fits / flat#AF96FFSplit-fit/flat color, lavender by default.
Panel backgroundrgba(16,26,44,0.95)Information-panel background color.
Panel text#F0F6FFPrimary panel text color.
Secondary text#C5D4E8Secondary text color.

06 Historical workload and events

9 inputs
Input labelDefault / optionsWhat it controls and when to adjust it
Calculation budget, bars600 / min 100, max 4000Historical budget, default 600 bars. Latest adds warm-up; research treats it as a hard admitted-range limit. Exceeding it blocks the main research display rather than shortening the regression.
Confirmed descriptive event markersOnShows confirmed descriptive event glyphs, not trade signals.
Retained event markers60 / min 0, max 240Event-glyph retention cap, default 60; zero hides drawings.
Event marker sizeTiny / options: Tiny, Small, NormalText-only glyph size: Tiny 10px, Small 12px, Normal 14px. No filled symbol background.
Event display window, bars240 / min 20, max 4000Recent event display window, default 240, bounded by the calculation budget. It does not change fit length, statistics or alerts.
Research: no marker spacing filterOffDisables research glyph spacing only; count and window caps remain. Numeric events are retained independently of drawing filters.
Minimum same-side marker spacing, bars4 / min 0, max 100Display-only spacing applied separately above and below candles, default four bars. Hidden events still affect statistics and configured alerts.
Marker clearance, ATR units0.45 / min 0.1, max 3Clearance beyond current and previous two candle wicks in ATR(14), default 0.45, with a four-tick minimum. ATR is placement-only, not a fixed pixel guarantee.
Event symbols instead of lettersOnUses !, ↺ and =; off selects O, R and I. Glyph placement is not an execution price.

07 Frozen paths and matched comparisons

12 inputs
Input labelDefault / optionsWhat it controls and when to adjust it
Show historical frozen pathsOnShows chronological fixed-origin paths through reached confirmed observations. Disabling drawings leaves the path study active.
Frozen path length, bars24 / min 4, max 120Path outcome length L, default 24, excluding the origin. Completion requires all L observations; this is separate from endpoint research.
Gap between paths, bars24 / min 0, max 240Gap between outcomes, default 24, gives 48-bar origin spacing. With zero gap completion precedes the next start on one close. Training windows can still overlap.
Path schedule anchor2020-01-01 00:00 UTCDefault schedule anchor is 2020-01-01 00:00 UTC. The first loaded qualifying close seeds bar-count scheduling; PHASE* warns that earlier history may change the phase.
Matured path sample, slots32 / min 2, max 200Completed-slot retention, default 32 for Latest/Rolling. Missing-data slots consume retention but not valid denominators; Selected interval uses all completed slots. Open paths are not successes or failures.
Retained drawings, paths4 / min 0, max 12Visual path cap, default four, maximum twelve, including an open path. Zero hides paths without removing observations.
Frozen path drawingForward only / options: Forward only, Fit + forwardForward only shows reached outcomes. Fit + forward restores the original training fit as faint dotted lines, known only at its origin, not at every earlier candle.
Historical line transparency48 / min 10, max 85Historical-path transparency, default 48.
Historical line thickness1 / min 1, max 3Historical-path thickness, default one.
Text-only path IDs and resultsOnShows F IDs and text results: ALL, BACK, OUT, DATA, or unfinished k/L. Final labels appear only at maturity.
First-exit residual connectorOnConnects the first sampled outside Source value to the fixed center. It is not a stop order, intrabar crossing or fill.
Observed-end residual connectorOnConnects the latest evaluated Source value to the fixed center.

08 Numeric history output

1 input
Input labelDefault / optionsWhat it controls and when to adjust it
Numeric history pageMatch panel / options: Match panel, Model, Refit research, Horizon research, Frozen pathsSelects numeric history independently, or Match panel follows the visible page. M/R/H/F and the page ID identify field meanings. The 53 fields are available across pages, not simultaneously; switch and export again using the tooltip mapping.
05 — Alerts

Six confirmed-close alert conditions

Create alerts manually in TradingView. They operate in Latest, not As-of research. Path start/completion/exit bits are research records rather than extra standalone alert conditions.

  • Outside prior channel — Transition outside the respective prior envelope, including a direct switch between outside sides.
  • Inside prior channel again — Transition inside the respective prior envelope; not proof of recrossing one unchanged boundary.
  • Refit inclusion appeared — An outside-prior observation becomes inside after refitting.
  • Refit exclusion appeared — An inside-prior observation becomes outside after refitting.
  • Coverage gap appeared — The configured in-fit versus next-bar coverage gap appears.
  • Half-window slopes disagree — Older and recent half-window slopes point in opposite non-flat directions.
06 — Limitations and responsible use

Not a buy/sell signal

This tool is for analysis and visualization. It is not investment advice, a trade recommendation, a forecast, or a promise of profit or accuracy. Results depend on inputs, symbol, timeframe, and data feed. You remain responsible for every trading decision.

Do not call the whole indicator non-repainting

Current fitted history redraws as the window changes. Restored training fits were known only at their origin. Fixed-path coefficients remain fixed within a path, but changed settings, history, schedule phase or feed revisions can change the reconstructed study.

Width is not a probability interval

Wide envelopes can have high coverage with little directional information. High R² and a 90th percentile do not establish future predictive skill, calibrated probability or significance. The components do not vote on an optimal model or trade score.

Missing, open and exited are different

DATA consumes a retention slot but is excluded from valid denominators. k/L is unfinished, not success or failure. Mean first-exit age conditions on exited valid completed paths; it does not assign zero to unexited paths or estimate survival.

Fix the scheduling phase

PHASE* warns that the anchor is at/before loaded history and more history can move the schedule. Anchor within loaded history with preceding bars available and hold symbol, timeframe, settings and interval fixed. Invalid origins are skipped, not relocated. F IDs are local, not permanent identifiers across recalculations.

Respect budgets and sample scopes

RANGE > CAP requires narrower dates or a larger budget. Remaining traces or records may be partial, not a complete interval result. Drawing retention differs from numerical slots, and rolling aggregation differs from interval-wide aggregation.

Data and dependence

Bars are not calendar duration. Non-standard candles, external sources, missing observations and feed revisions can change interpretation. No volume, external requests, higher-timeframe data or imported libraries are needed; ATR is only for glyph clearance. Non-overlapping outcomes do not make market data or training windows independent.

Important

This is descriptive model research, not order placement or a strategy simulation. Containment and error skill are not profitability. Compare like-for-like symbol, timeframe, Source, width and valid sample counts.

07 — FAQ

Frequently asked questions

Clarify fitted history, endpoint coverage and fixed-path interpretation.

Does a 90th percentile imply 90% future coverage?

No. It is a fitted-window residual rank, not a calibrated future probability or confidence interval.

Does refit inclusion mean price returned?

Not necessarily. Center movement, width expansion or both can accommodate the same observation; inspect matched before/after geometry.

How do BACK and ALL differ?

BACK finishes inside after an earlier sampled exit; ALL keeps all sampled outcomes inside. Neither is a profit result or an intrabar-wick guarantee.

Does research hide later candles?

No. It reconstructs a selected model but does not crop the chart or provide blind replay. Alerts are disabled.

Is the indicator free?

It is a free open-source TradingView indicator. The publication specifies Mozilla Public License 2.0; check license conditions before reuse.

Source basis and update policy

This guide is grounded in SG Group’s live catalogue, the script’s published TradingView description, and the user-facing inputs in its open source. Labels and defaults can change after a script update.